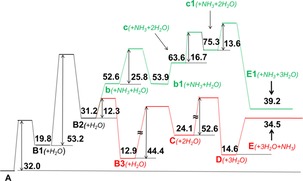
Figure 6.

Energy profile (▵H° in kcal mol−1) of the protonated D‐fructose‐NH3 adduct dehydration computed at the B3LYP/6‐31G(2df,p) level of theory. Red line, dehydration path through NH3‐bound intermediates (Figure 4). Green line, dehydration path by preliminary loss of NH3 (Figure 5).
