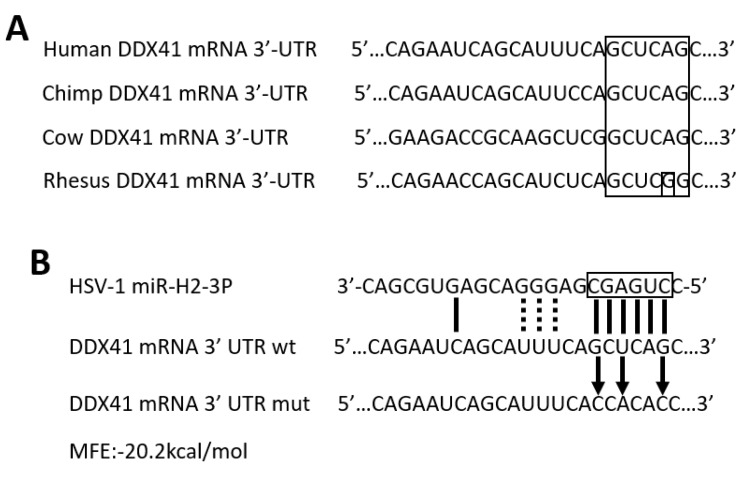
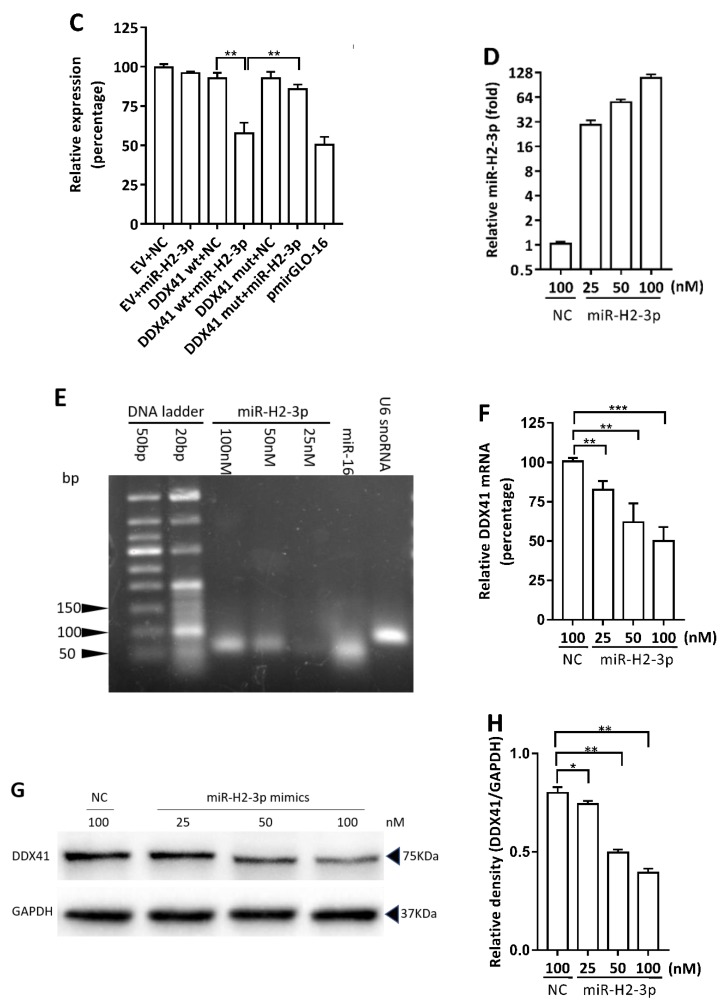
Figure 2.
miR-H2-3p targeted DDX41 directly. (A) Sequence alignment of DDX41 from different species for conservative analysis. The seed region binding within DDX41 in the big black rectangular frame, especially G:U wobble base pairs in the small black rectangular frame. (B) Sequence alignment of miR-H2-3p and its binding sites in the 3′-UTR of DDX41. The seed sequence in the 5′ region of miR-H2-3p is shown in the black rectangular frame, pairing nucleotides in black short sticks or black short dashed line (only for G:U wobble base pairs), mutant sites in black short arrows. (C) HEK-293T cells were co-transfected with empty plasmid (EV), pmirGLO-DDX41-3′-UTR wild-type (DDX41 wt) plasmid, pmirGLO-DDX41-3′-UTR mutation (DDX41 mut) plasmid, and miR-H2-3p mimics (miR-H2-3p) or NC as indicated. After 24 h of transfection, the cells were harvested and dual-luciferase reporter assay was performed. The values were standardized to 100% in the EV + NC groups. Data are the means ± SD (n = 3) from one representative experiment. Similar results were obtained from three independent experiments, using pmirGLO-16 as an internal control. NC, Negative control. (D,E) HEK-293T cells were transfected with miR-H2-3p mimics or NC at indicated final concentrations. After 24 h of transfection, total RNA was extracted and miR-H2-3p expression was determined by qRT-PCR (D) or RT-PCR (E). The values were normalized to U6 snoRNA and standardized to 1 in the NC groups. Data are the means ± SD (n = 3) from one representative experiment. Similar results were obtained from three independent experiments, using hsa-miR-16 (miR-16) as an internal control. (F–H) HEK-293T cells were transfected with miR-H2-3p mimics or NC at indicated final concentrations. After 24 h of transfection, total RNA was extracted and DDX41 mRNA expression was determined by qRT-PCR (F) or DDX41 protein by immunoblotting (G), and the relative density of DDX41 protein was determined using ImageJ software (H). The values were normalized to GAPDH and standardized to 100% in the NC groups (F), using GAPDH as a loading control (G and H). Data are the means ± SD (n = 3) from one representative experiment. Similar results were obtained from three independent experiments. * P < 0.05; ** P < 0.01; *** P < 0.001.


