Figure 4.
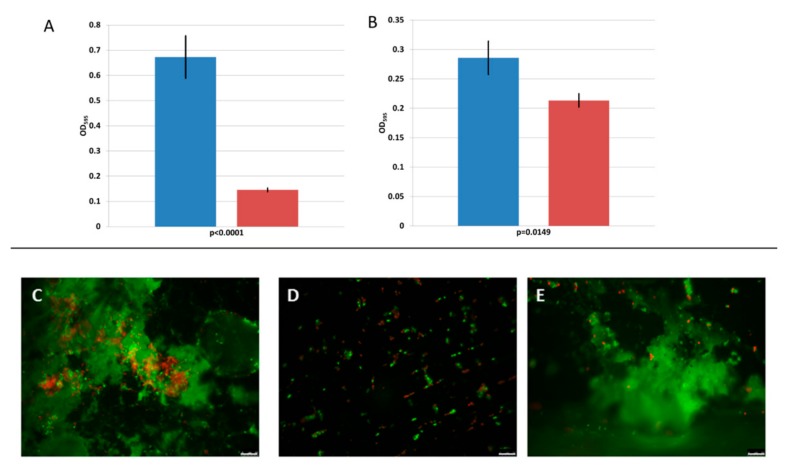
Biofilm prevention (A) and biofilm removal ability (B) of the 293-amidase (75 μg/mL) against L. monocytogenes 473 in microtiter plates assays. The blue bars represent the controls (untreated biofilm) and the red bars the treatments. Values are the average of triplicates and the standard deviation is represented as error bars. The p-values are shown below the horizontal axes. (C–E) The images obtained from the stainless-steel coupons assays. (C) L. monocytogenes 473 biofilm after 4 days of incubation at 20 °C. (D) Co-inoculation of L. monocytogenes 473 and 293-amidase (150 μg/mL). (E) The application of 293-amidase (150 μg/mL) on a 4 day old biofilm. The red-stained cells were damaged or dead, while the green stained cells were alive. The scale bars at the bottom-right in (C–E) are 10 µm.

