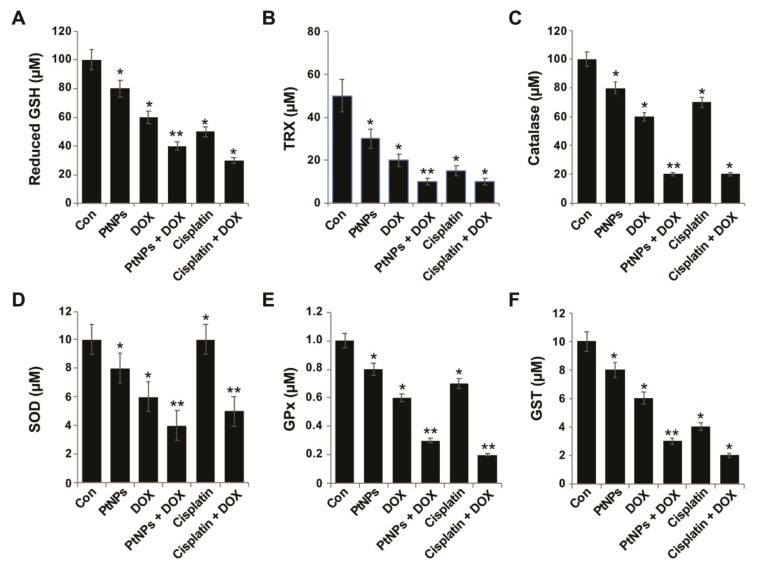
Figure 10.
Effect of PtNPs and DOX on antioxidant markers. U2OS cells were treated with PtNPs (10 μg/mL), DOX (1 μg/mL), CIS (5 μg/mL), or a combination of PtNPs (10 μg/mL) and DOX (1 μg/mL) or combination of DOX (1 μg/mL) and CIS (5 μg/mL) for 24 h. After incubation, the cells were harvested, washed twice with an ice-cold PBS solution, collected, and disrupted by ultrasonication for 5 min on ice. (A) Glutathione reductase activity (GSH) was measured by monitoring the rate of NADPH oxidation. Oxidation of NADPH was monitored spectrophotometrically in kinetic mode for 5 min at 340 nm. Glutathione reductase activity was proportional to the rate of absorbance decrease. (B) Thioredoxin reductase (TRX) activity was measured by monitoring the conversion of DTNB to TNB by reduced thiols. Cell lysate was mixed with 100 μL of solution containing 5 mM DTNB and 250 μM NADPH. Absorbance was monitored spectrophotometrically in kinetic mode for 5 min at 405 nm. Thioredoxin reductase activity was proportional to the difference in TNB generation rate in samples. (C) Catalase activity was assayed by monitoring the rate of removal of exogenously added hydrogen peroxide in a colorimetric reaction. Absorbance was measured at 520 nm. Catalase activity was proportional to the difference in absorbance between a control sample and treated sample. (D) Superoxide dismutase activity was assayed by monitoring the rate of removal of exogenously added superoxide. Superoxide dismutase activity was proportional to the difference in absorbance increase rate between a control sample and the treated sample. (E) Glutathione peroxidase activity (GPx) was measured indirectly by monitoring NADPH consumption in a coupled reaction with glutathione reductase and (F) Glutathione S-Transferase (GSTs) activity was assayed spectrophotometrically at 25 °C with reduced glutathione (GSH) and 1-chloro-2, 4-dinitrobenzene (CDNB) as substrates. GST concentrations are expressed as micromoles. Differences between the treated and control groups were measured using Student’s t-test and statistically significant differences are indicated by * (p < 0.05). The results are presented as mean ± standard deviation of three experiments. * p < 0.05 was considered significant; ** p < 0.01 was considered highly significant and *** p < 0.001 was considered very highly significant.

