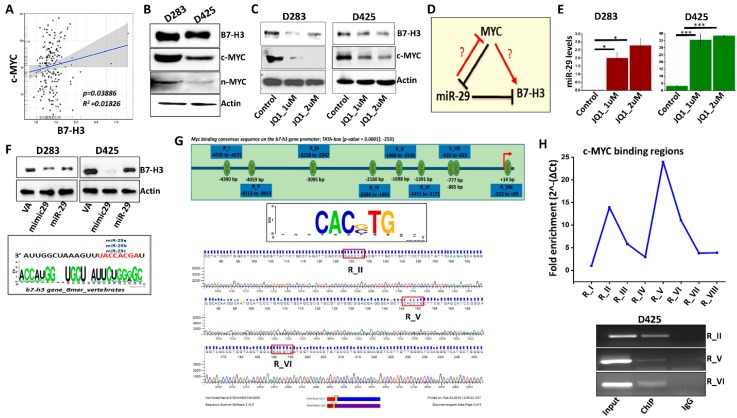
Figure 2.
B7-H3 expression is regulated by Myc and miR-29. (A) mRNA transcript levels of Myc and B7-H3 in MB patient samples from Northcott dataset. (B) Protein expression levels of B7-H3, c-Myc and n-Myc in D283 and D425 cells determined by western blotting with Actin as a loading control. (C) Western blot analysis of c-Myc and B7-H3 protein levels in D283 and D425 cells treated with JQ1 (1 μM and 2 μM) incubated for 24 h. Actin used as loading control. (D) Schematic representation of Myc-miR-29-B7-H3 regulatory axis. (E) miR29 transcript levels in D283 (left) and D425 (right) cells treated with JQ1, 24 h incubation as determined by RT-PCR (n = 4 for each group). (F) Western blotting showing B7-H3 expression in D283 (left) and D425 (right) cells transfected with scrambled vector (VA), miR-29 mimic (mimic29) or miR-29b/a plasmid (miR-29). Cells were harvested 48 h after transfection, Actin used as loading control. (Bottom) Analysis of 3’ UTR of B7-H3 mRNA with consensus binding sequence homology with miR-29 isoforms. Developed from microRNA.org database. (G) B7-H3 promoter analysis showing 9 potential Myc-binding sites (CAC(GC)TG; p = 0.0001) on promoter sequence from −5000 to +100 bp. (Top); Promoter sequence developed from Eukaryotic Promoter Database. (Bottom); Sequencing analysis of RI, RV and RVI regions. (H) To investigate MYC binding to the B7-H3 gene promoter, D425 DNA was immunoprecipitated with anti-MYC and anti-IgG antibody. ChIP DNA was analyzed by qRT-PCR using ChIP-specific primers spanning the regions, R-I to R-VIII (primers listed in Table S2), (Top); fold enrichment of MYC protein on the B7-H3 promoter region (RI-RVIII) was quantified and represented graphically. (Bottom); agarose gel showing the PCR amplified regions (RI, RV and RVI) using input, IgG and ChIP DNA. * p < 0.05, ** p < 0.01, *** p < 0.001.

