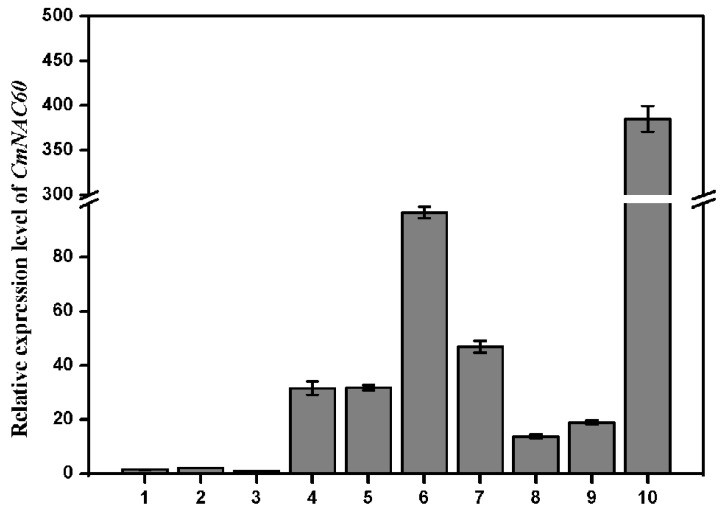
Figure 2.
Relative expression levels of CmNAC60 in different organs of oriental melon. The numbers represent the following: (1) seeds, (2) cotyledon (3) hypocotyls (4) young leaves, (5) stem (6) root (7) tendril (8) 15 d fruit after pollination, (9) female flower, and (10) male flower. The expression levels are calculated relative to the CmNAC60 expression in the hypocotyls, which was set as 1. The 2−ΔΔCT method was used in the qRT-PCR analysis. Data are mean ± standard deviation (SD) from three biological replicates. Bars indicate standard deviation.

