Figure 4.
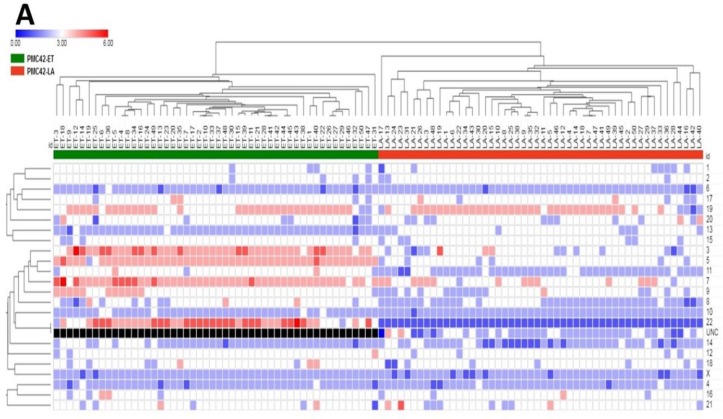
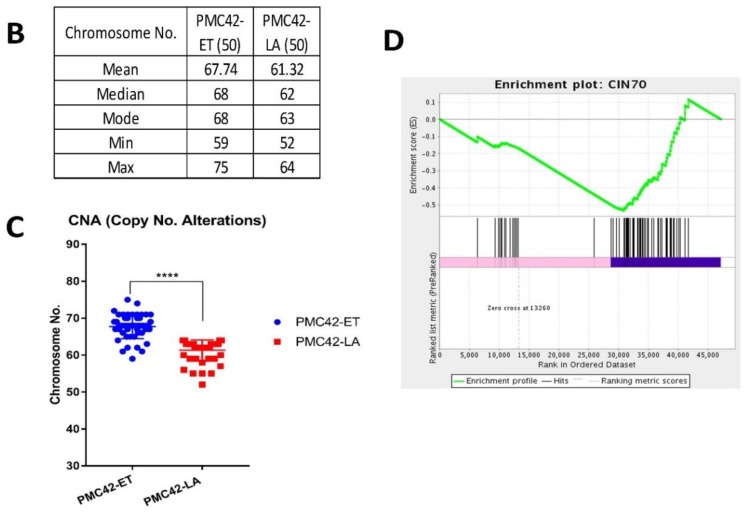
Chromosomal ploidy distribution of PMC42 cell lines. (A) Heatmap for copy number distribution of chromosomes deciphered from 50 karyotypes from each of the PMC42-ET and PMC42-LA cell lines (UNC: Unidentified Chromosome). (B) Distribution of chromosome numbers of PMC42-ET and PMC42-LA cell lines. (C) Chromosome numbers analysed from PMC42-ET and PMC42-LA for a total of 50 cells were compared for each cell line. Significance was determined by an unpaired t test with Welch’s correction, with **** p < 0.0001. (D) CIN70 enrichment plot following Gene Set Enrichment Analysis.


