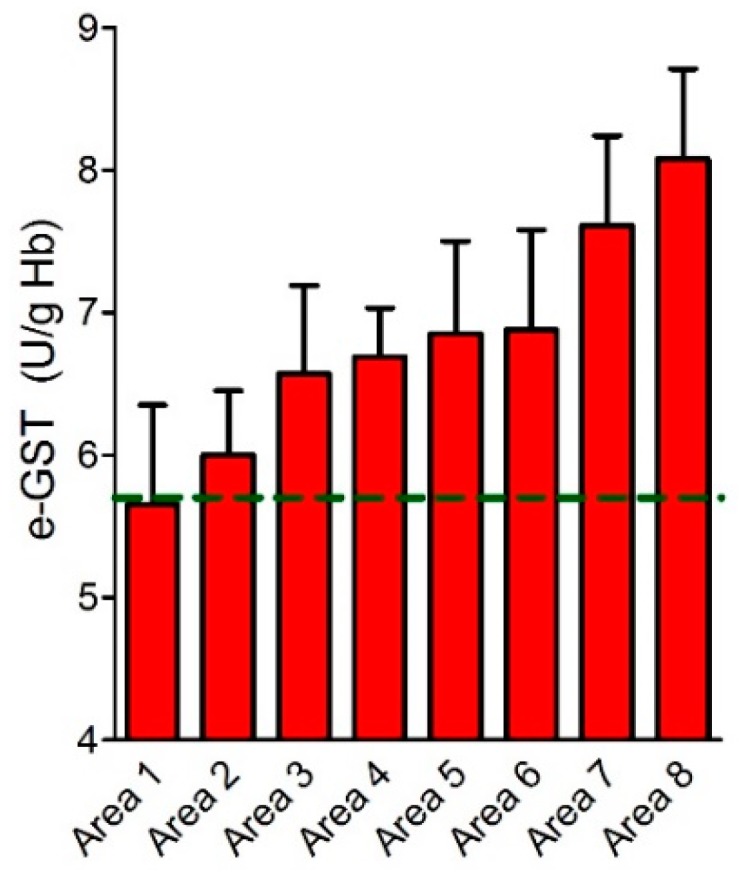
Figure 10.

Erythrocyte glutathione transferase (e-GST) activity in the Sacco River valley. e-GST activity in the population of eight selected areas monitored (area 1–8, red bars) compared to the e-GST activity reference value for the Rome area (dotted green line) (modified from Reference [177]).
