Figure 3.
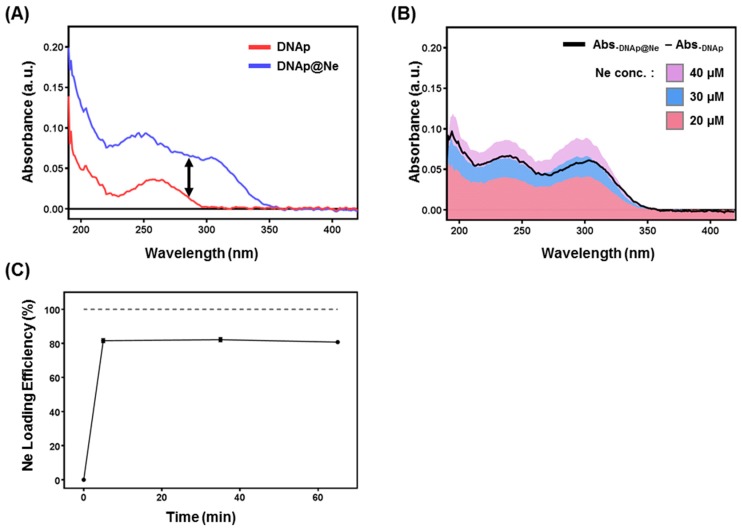
Stoichiometric analysis of netropsin loading on DNAp. (A) UV–vis spectra of DNAp and DNAp@Ne. The netropsin treatment time for synthesizing DNAp@Ne was 6 h. DNAp and DNAp@Ne were adjusted to final concentrations of 100 ng μL−1 (DNAp: red, DNAp@Ne: blue). (B) Stoichiometric analysis of netropsin in DNAp@Ne. The increase in UV–vis absorbance of DNAp@Ne as a function of the absorbance of DNAp (black line) was similar to that of the free netropsin (netropsin 40 μM: purple, 30 μM: blue, 20 μM: red). (C) Time-dependent netropsin loading profile on DNAp@Ne where 100 μM of netropsin was added to a solution of 100 ng μL−1 of DNAp and measured at various time points.

