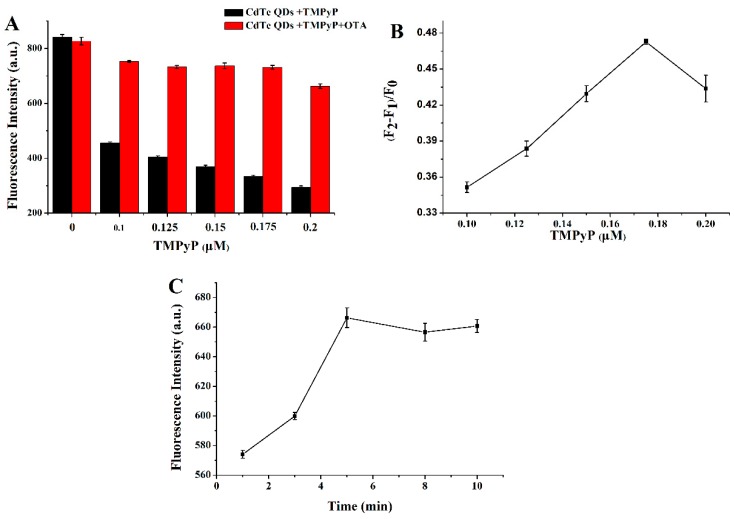
Figure 3.
(A) Fluorescence intensity histogram of CdTe QDs/TMPyP and CdTe QDs/TMPyP/OTA aptamer in the presence of 0.1 μmol L−1, 0.125 μmol L−1, 0.15 μmol L−1, 0.175 μmol L−1, and 0.2 μmol L−1 of TMPyP. (CdTe: 4.2 × 10⁻⁹ mol L−1; OTA: 20 ng mL−1). (B) The linear plot of fluorescence intensity (F2 − F1)/F0 as a function of TMPyP (n = 3). (C) Fluorescence intensity as a function of incubation time (1, 3, 5, 8, and 10 min). (CdTe: 4.2 × 10⁻⁹ mol L−1; TMPyP: 0.175 μmol L−1; OTA: 15 ng mL−1).

