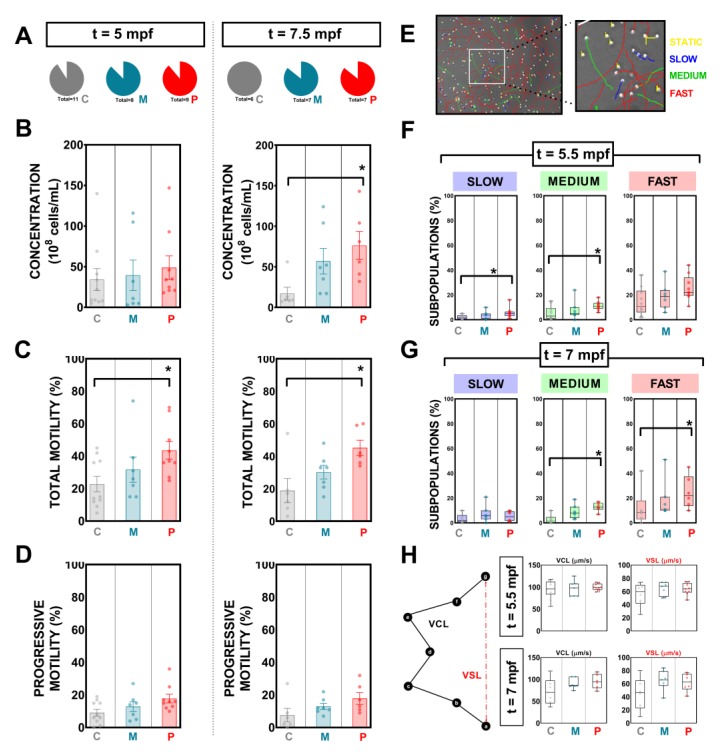
Figure 4.
Mixture supplementation effects on zebrafish sperm kinematics after a long exposure of ingestion. (A) Percentage of spermiating males at the two studied times. (B) Concentration, (C) total motility, and (D) progressive motility at 5 and 7.5 mpf reported for each experimental group. (E) Example of a CASA field rendering static, slow, medium, and fast subpopulations. (F) Sperm subpopulations within the motile population according to speed parameters at 5 and 7.5 mpf (G) for each group. (H) Diagram describing curvilinear and straight velocities and box graphs (whiskers show min. to max.) at different key temporal points showing results from each experimental group. Data are presented as means ± s.e.m. “C”, “M”, and “P” refer to the experimental groups: control diet-fed, maltodextrin-fed, and probiotics-fed, respectively. Asterisks show statistically significant differences: * (p < 0.0500).

