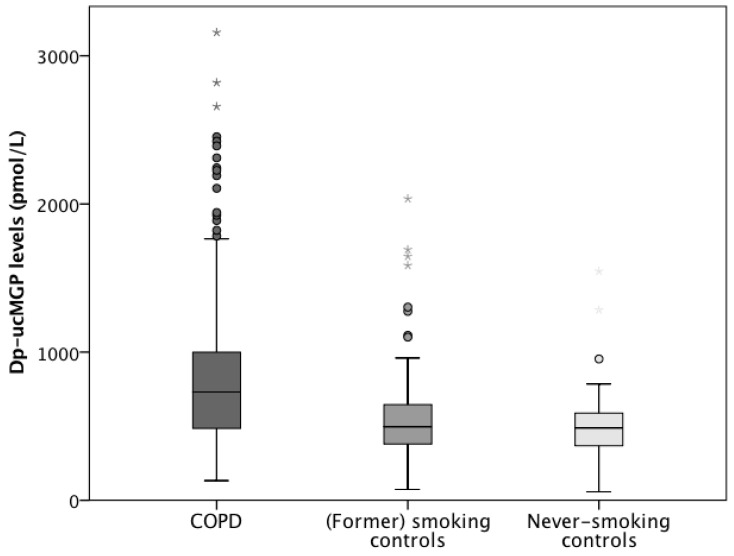
Figure 2.
Boxplots (5th percentile, 1st quartile, median, 3rd quartile, and 95th percentile) showing a significant difference in plasma desphospho-uncarboxylated Matrix Gla Protein levels between COPD patients (dark grey), (former) smoking control subjects (middle grey) and never-smoking control subjects (light grey) in the ICE-Age study. Outliers are presented as points and extreme outliers as asterisks.

