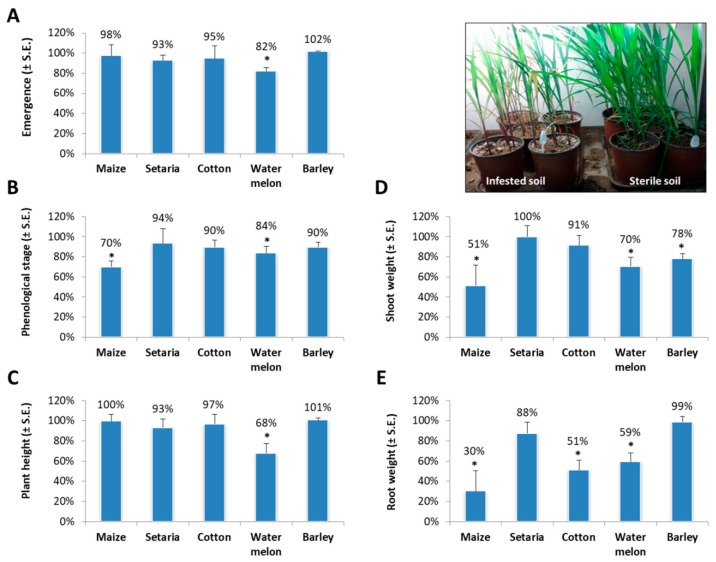
Figure 2.
Sprout pathogenicity assay. Symptoms evaluation was made for the cultivar species inspected in Figure 1. Values are expressed as being different from the control (uninfected plants) in percentages. Sprout emergence (A), phenological stage (numbers of leaves, (B), plant height (C), aboveground parts wet weight (D), and root wet weight (E) were determined after growing the different plant species in a soil infected with M. maydis in a growth chamber for 37 days. The results are the average of two separate experiments; each included five independent replications (pots). Vertical upper bars represent the standard error. Significance from the control (untreated plants) is indicated as * = p < 0.05. Insert—photo of the sweet, sensitive maize Prelude cv. at the end of the experiment.

