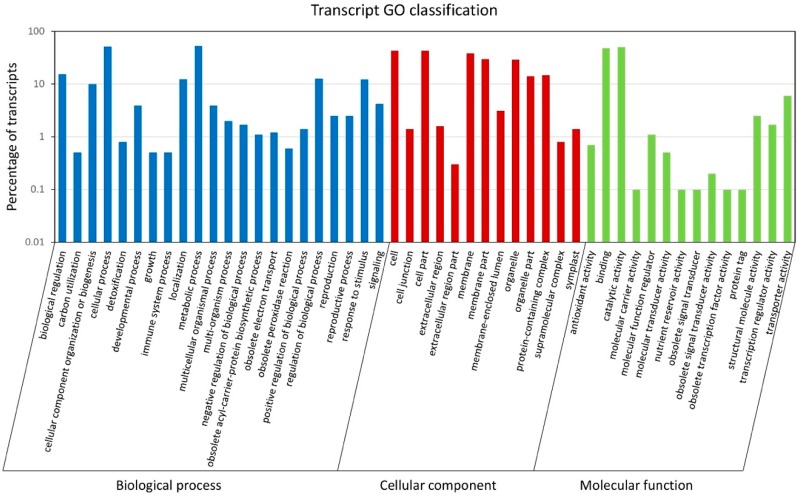
Figure 2.
Gene ontology classification of Lantana camara unique transcripts. The histogram shows the classification of unique transcripts under three categories, including biological process (blue), cellular component (red), and molecular function (green). The y-axis indicates the number of transcripts (log10 scale).

