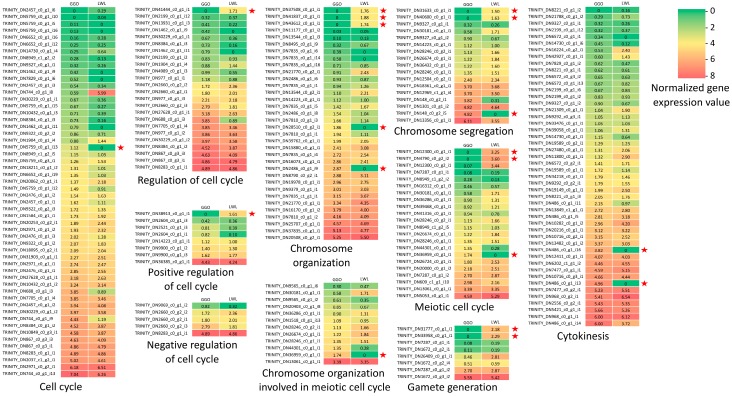
Figure 4.
Heat maps of gene expressions for genes potentially affecting gamete formation in LWL and GGO. The expression values are log2(x + 1) transformed. Left column indicates expression values in GGO. Right column indicates expression values in LWL. The normalized expression values vary from 0 (green) to 8 (red). The 18 transcripts that were expressed (expression value ≥ 1) in one genotype but not expressed in the other are labelled with a star sign.

