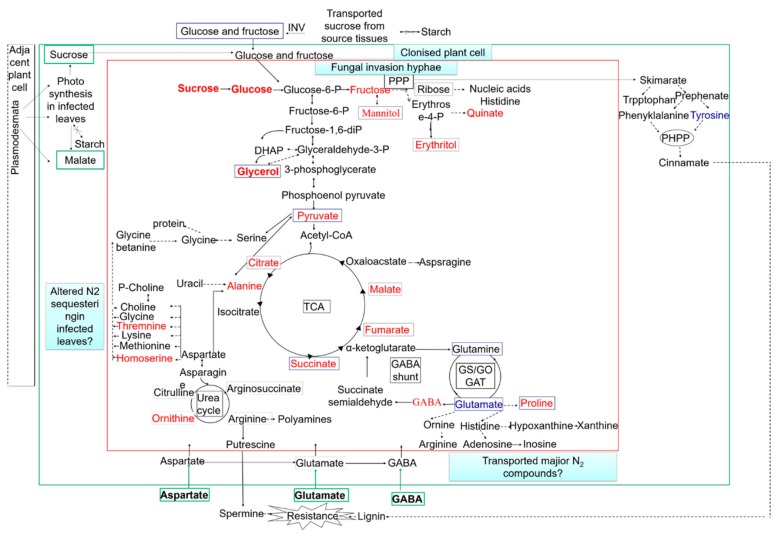
Figure 3.
Model summarizing fungal metabolic interactions with the colonized host. INV, invertase; PPP, pentose phosphate pathway; PHPP, phenylpropanoid pathway; TCA, tricarboxylic acid cycle. The metabolites in blue boxes are fungal metabolites that are predicted to increase after 3 days. The metabolites in green boxes are the major central carbon and nitrogen compounds that are likely to be derived from the host. Red font represent the upregulation metabolites; blue font represents the downregulation metabolites. The green arrows indicate transport across cell walls. The dotted arrows indicate multiple enzymic steps.

