
Figure 1.
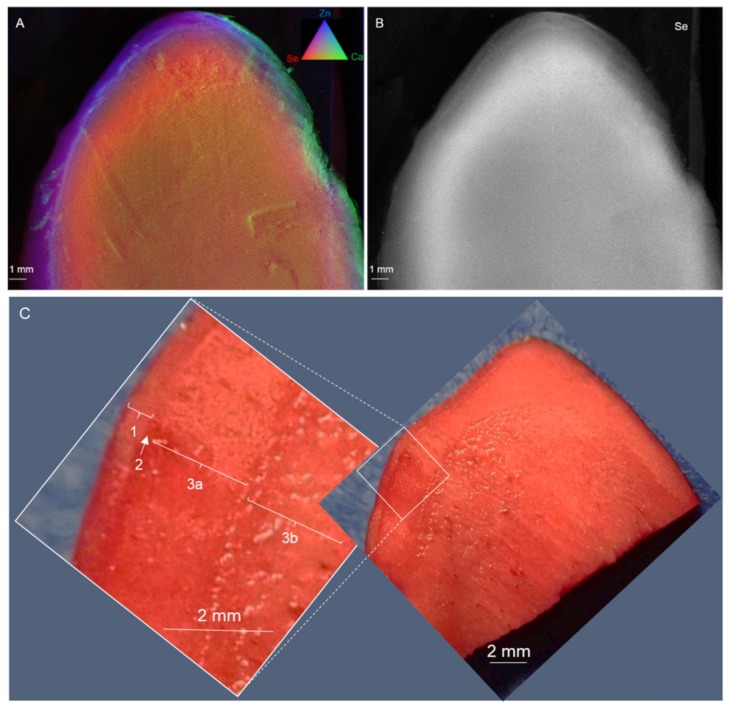
Micro X-ray fluorescence elemental distribution maps of a longitudinal section of Brazil nut #13 (25 mg Se kg−1, Table 1). Se is shown in red (A) or white (B). Panel A also shows Zn in blue and Ca in green. Panel (C) shows a longitudinal section of another Brazil nut stained with triphenyl tetrazolium (red); Numbered tissue layers are discussed in the text.