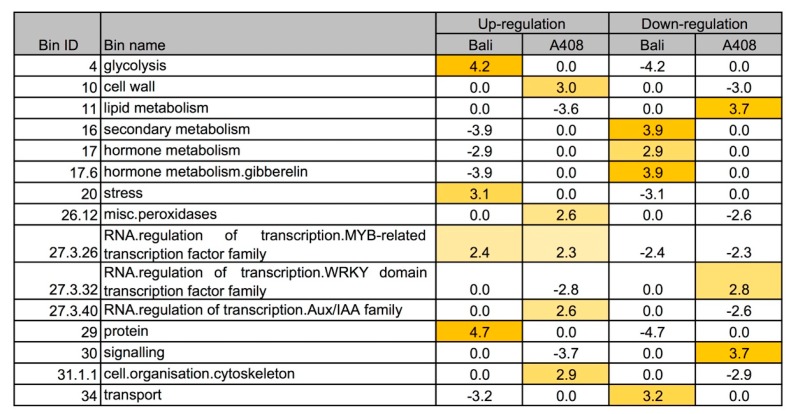
Figure 5.
Comparative transcriptome response for selected functional categories to WS in roots of “A408” and “Bali”. Over-representation analysis of the DEGs (FDR < 0.05). The statistical analysis of overrepresented functional categories was performed using Fisher method. Z-scores indicate over/under representation. (Number indicates z-score; Yellow indicates over-representation). Data used to generate this figure can be found in Table S4.

