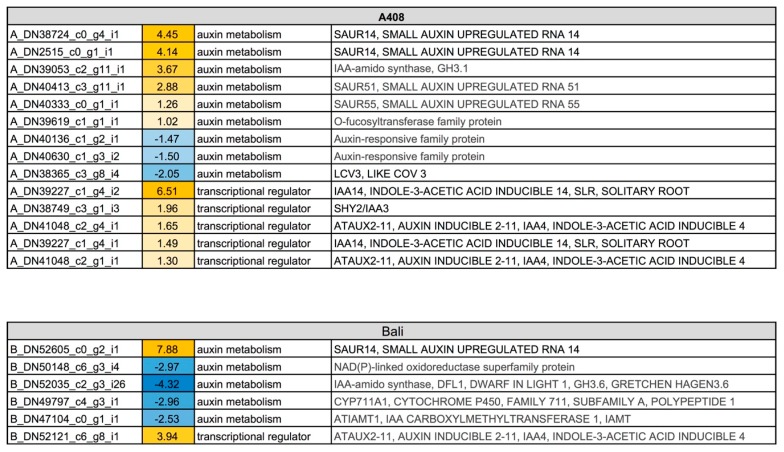
Figure 8.
Differential expression pattern of auxin metabolism and transcriptional regulator genes in roots of “A408” and “Bali” subjected to WS. The number indicates log2 fold changes. Blue indicates down-regulation. Yellow indicates up-regulation. Data can be found in Table S3.

