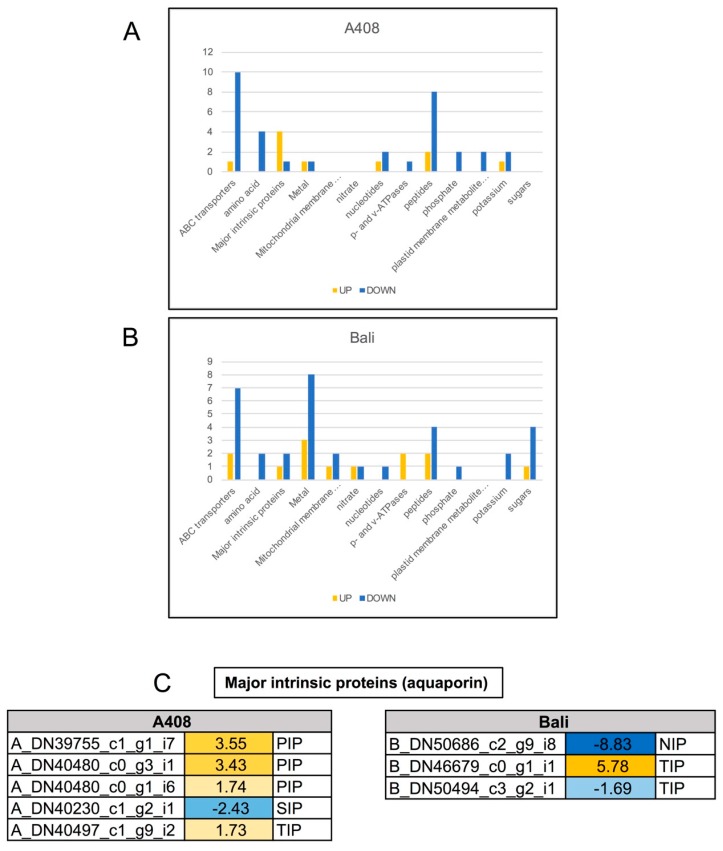
Figure 9.
Differential expression of transport genes in roots of “A408” and “Bali” subjected to WS. Graphical representation of WS-regulated transport genes based on their assigned protein families. “Up” and “Down” represent up-regulation and down-regulation in this analysis. (A) “A408”. (B) “Bali”. (C) Expression patterns of major intrinsic protein (aquaporin) genes in roots of “A408” and “Bali” under WS. The number indicates log2 fold changes. Blue indicates down-regulation. Yellow indicates up-regulation. Data can be found in Table S3.

