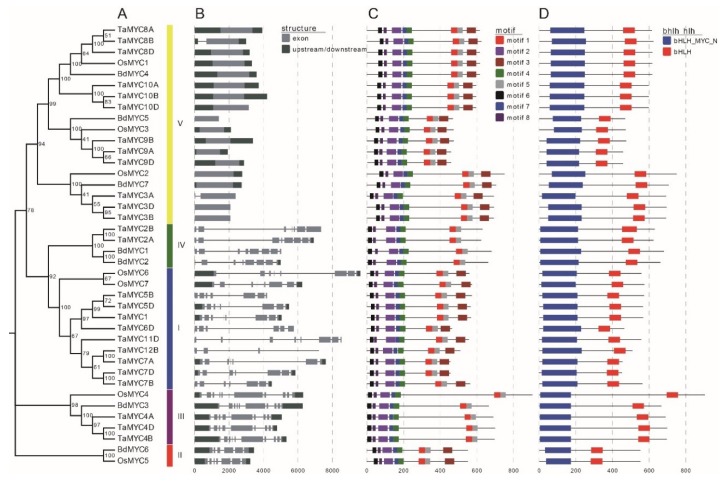
Figure 4.
(A) Phylogenetic relationships, (B) gene structures, (C) motifs, and (D) conserved regions of wheat, rice, and B. distachyon MYCs. The tree was constructed with 1000 bootstrap replications using MEGA7 based on the full-length protein sequence. The exon–intron structure of these genes was graphically displayed by the Gene Structure Display Server using the coding sequences (CDS) and DNA sequences of MYC genes. The protein sequence of MYC proteins was used to predict the conserved motifs/region by using the MEME Suite web server.

