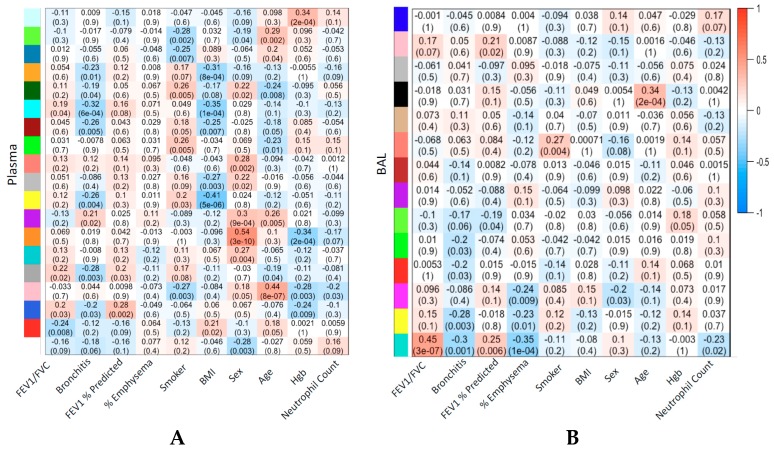
Figure 4.
Strength of correlation between weighted gene co-expression network analysis (WGCNA) modules and clinical variables and outcomes. Heatmap of module/clinical variable correlation. Plasma (A) or BAL (B). Module colors correspond to dendrogram in Figure S2. Cell text is Pearson correlation (p-value) between the first principal component representing the module and the corresponding variable. Plasma WGCNA modules without any correlation, p-values <0.01, are excluded (12 excluded, 19 displayed) for greater visual clarity. Full plasma WGCNA module to clinical variable correlations are shown in Figure S5.

