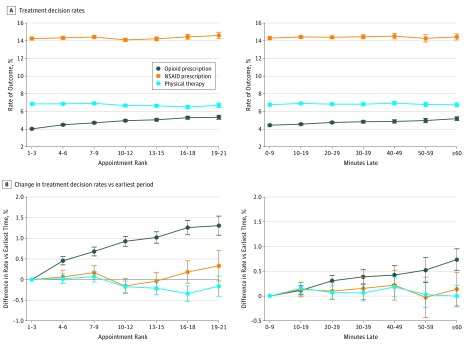
Figure. Pain Treatment Decision Rates and Changes in Rates by Appointment Timing.
Graphs show the absolute rate of each treatment decision by appointment rank and lateness (A) and the absolute percentage point change vs the earliest period (1st to 3rd appointments, or 0-9 minutes late) (B). Point estimates (circles) and 95% confidence intervals (whiskers) were estimated with the use of multivariate linear regression models with opioid prescribing, nonsteroidal anti-inflammatory drug (NSAID) prescribing, and referral to physical therapy as the dependent variables. The key covariate was appointment order and appointment lateness, respectively. All models were adjusted for patient characteristics (age category, sex, insurer, chronic condition count, and pain category), scheduled appointment duration, season-year fixed effects, and physician fixed effects. When appointment lateness was the key covariate, models were additionally adjusted for appointment start hour.

