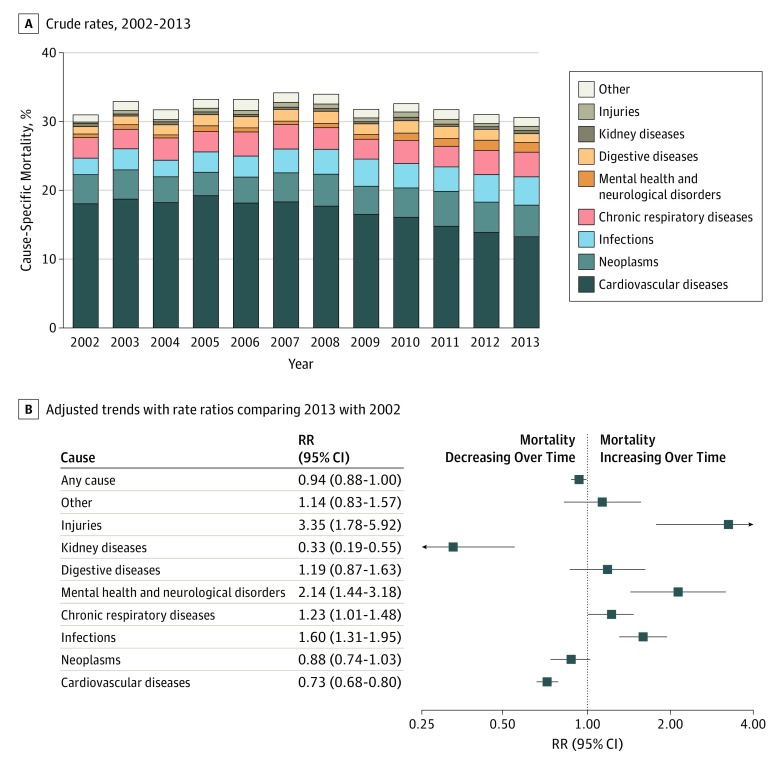
Figure 1. Temporal Trends in All-Cause and Cause-Specific Mortality Rates at 1 Year Following Incident Heart Failure.
A, Crude rates of all-cause and cause-specific mortality at 1 year following incident heart failure diagnosis. Labels for years 2002 and 2013 present individual causes of death as a share of the total number of deaths at 1 year. B, Rate ratios (RRs) from multivariable Poisson regression models comparing 1-year mortality rates in 2013 with 2002 by first reported cause, adjusting for patients’ age, sex, socioeconomic status, region, and 17 baseline comorbidities.

