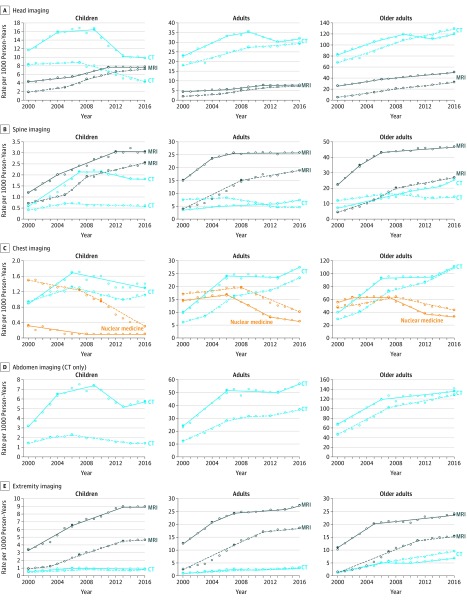
Figure 2. Imaging Rates per 1000 Person-Years by Anatomic Area, Imaging Modality, Age, and Country, Based on Joinpoint Analysis.
CT indicates computed tomography; MRI, magnetic resonance imaging. All US data are shown as solid curves; Ontario data are shown as dashed curves. Children are aged <18 years; adults, 18 to 64 years, and older adults, ≥65 years. See Table 3 for relative rates of imaging for United States compared with Ontario.

