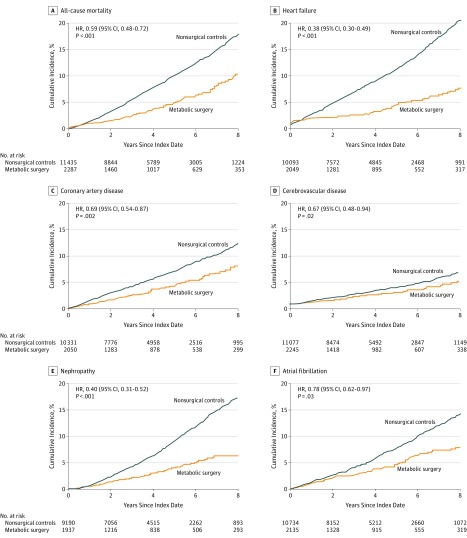
Figure 3. Eight-Year Cumulative Incidence Estimates (Kaplan-Meier) for 6 Individual End Points.
For each 5 individual outcomes (except all-cause mortality), any patient with a history of that outcome prior to the index date was eliminated from risk assessment only for that outcome. For all-cause mortality, median observation time was 4.0 years (interquartile range [IQR], 2.1-6.1) in the nonsurgical group and 3.3 years (IQR, 1.2-6.3) in the surgical group; for heart failure, 4.1 years (IQR, 2.2-6.2) and 3.3 years (IQR, 1.1-6.4); for coronary artery disease, 4.0 years (IQR, 2.1-6.1) and 3.3 years (IQR, 1.1-6.4); for nephropathy, 4.1 years (IQR, 2.2-6.2) and 3.3 years (IQR, 1.1-6.3); for cerebrovascular disease and atrial fibrillation, 4.0 years (IQR, 2.1-6.1) and 3.3 years (IQR, 1.1-6.3). HR indicates hazard ratio.

