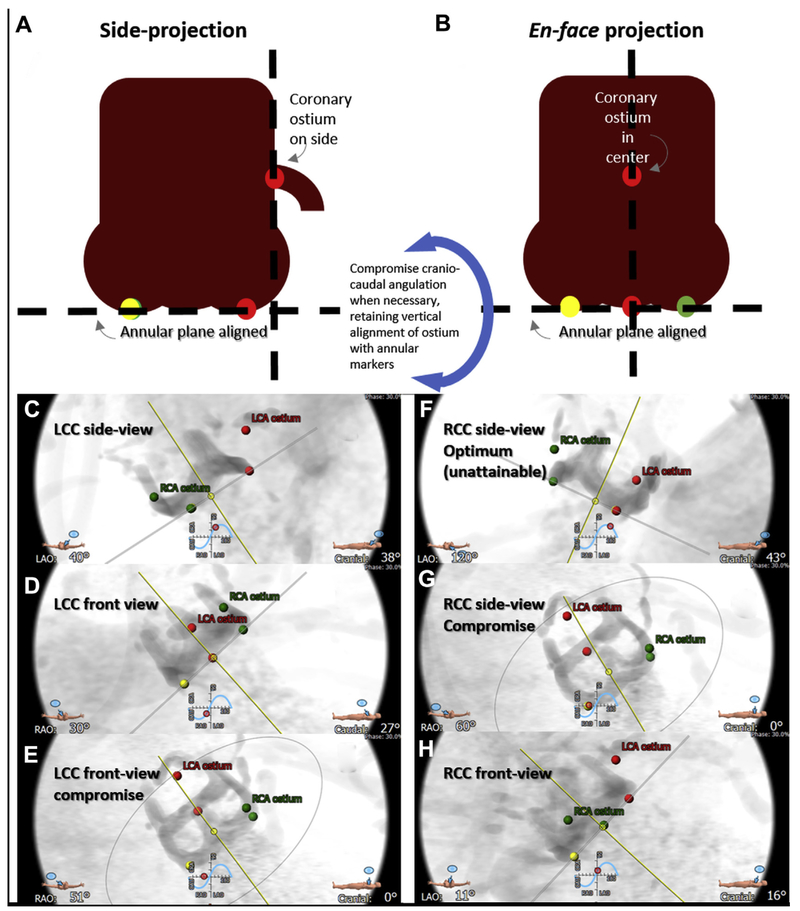
FIGURE 5. Projection Angles.
Computed tomographic prediction of fluoroscopic projections. First the annular plane is defined by the 3 annular nadir points (red, left coronary cusp [LCC]; green, right coronary cusp [RCC]; yellow, noncoronary cusp), along with corresponding coronary ostia. (A) The side projection is selected along the annular plane so that the intended annular marker and coronary ostium are on the lateral aspect of the aortic root, and the contralateral annular markers are overlapping. (B) In en face projection, the annular marker and corresponding coronary ostium lie along the centerline of the aortic root, and the annular markers are evenly spaced in a “1-1-1” projection. If either of these projections is fluoroscopically unattainable, the craniocaudal angulation is reduced, while preserving the side or center alignment, until an attainable projection angle is obtained. (Bottom) Representative LCC projections (C to E and Online Video 1) and RCC projections (F to H and Online Video 2). (C,F) Optimal side views. (D,H) Optimal en face views. (E,G) Compromise projections with reduced craniocaudal.

