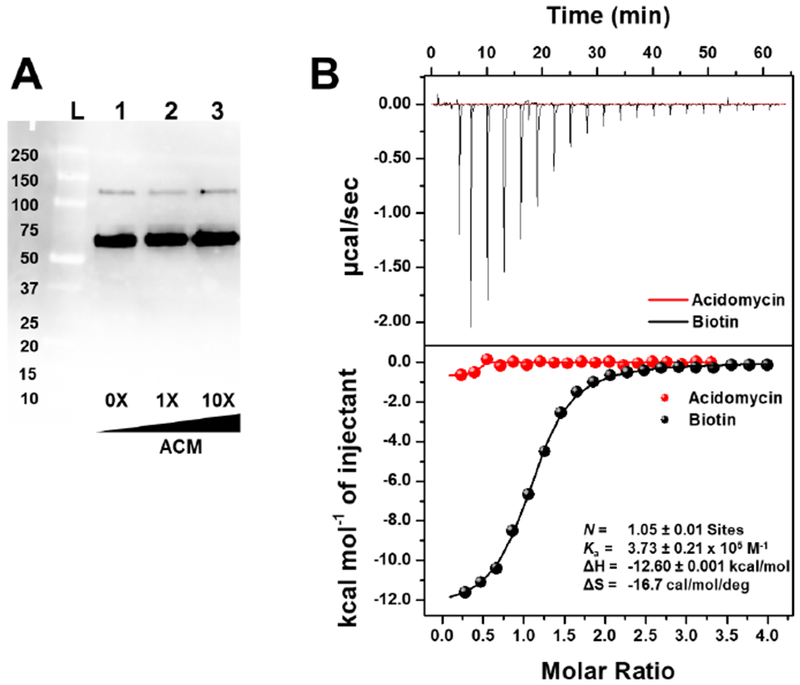
Figure 6.

A) Far-western blot of the biotinylated proteome of M. tuberculosis grown in biotin-free 7H9 media, in the presence of acidomycin. Concentration of acidomycin (μM) is depicted at the bottom of the blot. Lane L: Protein ladder; Lanes 1–3: M. tuberculosis grown in the presence of acidomycin at 0× (lane 1), 1× (lane 2) and 10× (lane 3) its MIC. This experiment was performed twice, independently. B) Isothermal titration calorimetry thermogram of (S)-(−)-acidomycin (750 μM, red) and biotin (750 μM, black) titrated into MtBPL (50 μM), with the binding data for biotin shown in black. This experiment was repeated twice, independently.
