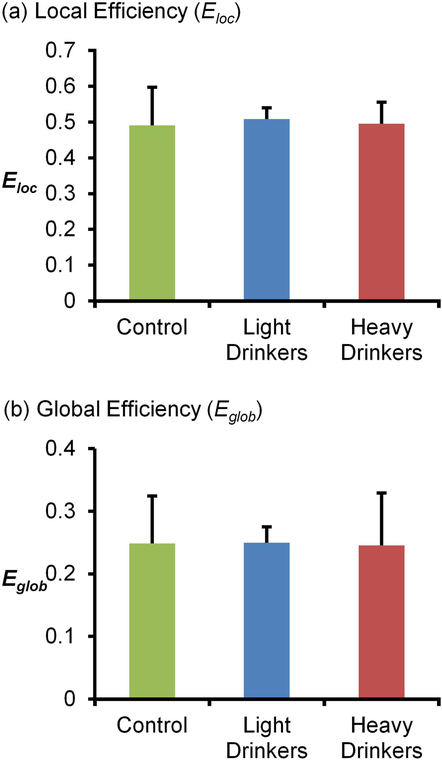
Figure 3. Comparison of average graph metrics after 12 months of chronic ethanol self-administration.
(a) Comparison of average graph metrics for local efficiency show no significant differences between control (0.49 ± 0.11SD), lighter drinkers (0.51 ± 0.03SD), and heavier drinkers (0.50 ± 0.06SD). (b) Similar results were found for global efficiency, with no significant differences between control (0.25 ± 0.08SD), lighter drinkers (0.25 ± 0.03SD), and heavier drinkers (0.25 ± 0.08SD).

