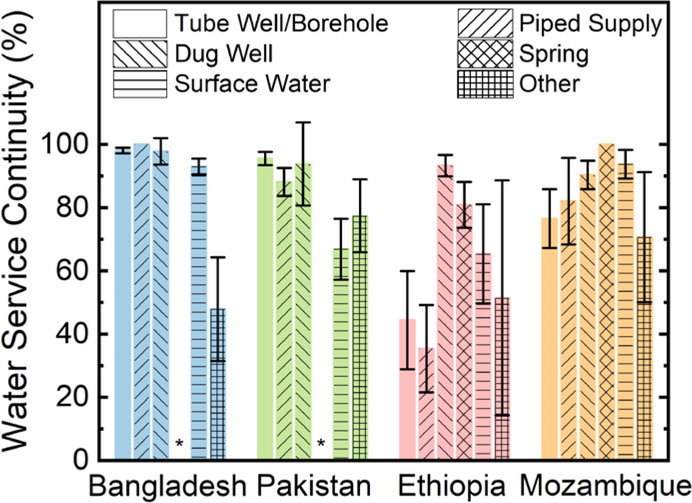
Figure 1.
Estimates of water service continuity (WSC) for household-water source combinations for the rural population of each country (with 95% confidence intervals –). A WSC of 100% indicates uninterrupted water supply over a year, while a WSC of 0% suggests no water supply over a year. An asterisk (*) indicates no observed cases.

