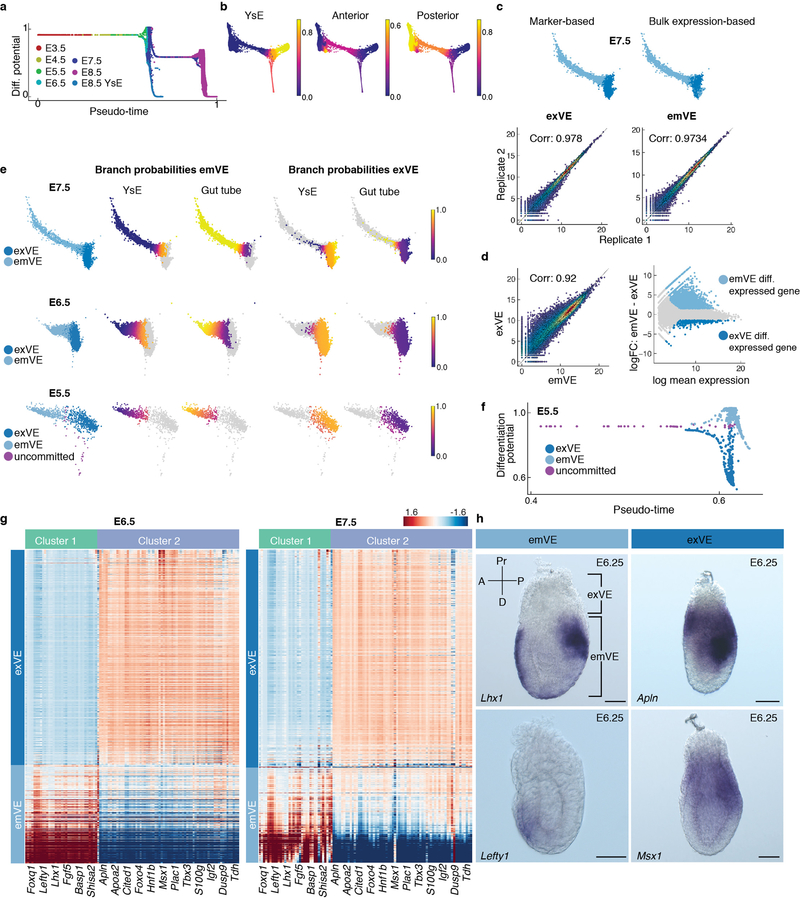
Extended Data Figure 7: Emergence of spatial patterning of the embryo at E5.5.
a, Plot showing Palantir pseudo-time versus differentiation potential of VE cells from stages E3.5-E8.75. Drops in differential potential occur at two time points. The first at E5.5, as cells acquire a distal versus proximal fate and the second at E7.5 as cells acquire an anterior versus posterior fate. b, Plots of branch probabilities of commitment towards yolk sac endoderm (YsE), anterior and posterior gut endoderm. c, Marker based (i) and bulk RNA-seq based (ii) prediction of exVE and emVE at E7.5. (iii) Plots showing the Pearson correlation between bulk RNA-seq replicates of exVE and emVE. d, (i-ii) Plots showing differentially expressed genes between of exVE (291 genes) and emVE (2239 genes) derived using bulk RNA-seq data. e, Plots showing the branch probabilities of E7.5, E6.5 and E5.5 exVE and emVE cells to commit towards YsE (extra-embryonic) and gut tube (embryonic). Cells labeled as exVE and emVE based on expression of known markers (plot on the left), match expected Palantir branch probabilities (4 plots on the right). Branch probabilities of E5.5 cells in committing towards YsE and gut tube were used to infer putative exVE and emVE identities at E5.5. f, Plot showing pseudo-time versus differentiation potential of endoderm cells at E5.5 colored by the inferred cell type. (A zoomed in view of Extended Data Fig 7a). g, Heatmaps of highly expressed genes specifically in exVE or emVE at E5.5 also distinguish exVE and emVE cells at E6.5 and E7.5. h, ISH of E6.25 embryos showing expression of Lhx1 (n = 3) and Lefty1 (n = 3), genes specific for emVE, and Apln (n = 3) and Msx1 (n = 3) specific for exVE. Scale bars: 50μm. A, anterior; D, distal; P, posterior; Pr, proximal.

