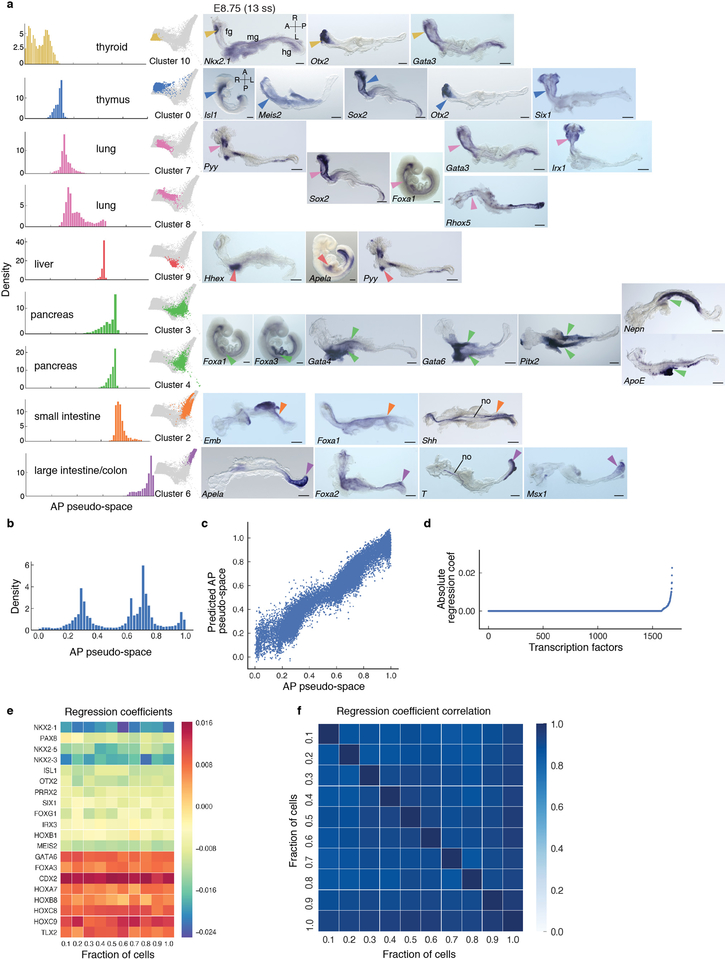
Extended Data Figure 9: Spatial patterning of the gut tube at E8.75.
a, Plots showing individual Phenograph clusters densities of the E8.75 gut tube cells ordered along AP pseudo-space (left panel) and in force directed layouts (middle panel). In situ hybridization of representative differentially expressed genes in each cluster on whole E8.75 embryos (n > 3 for each gene) or micro-dissected E8.75 gut tubes (n > 3 for each gene) (right panels). Arrowheads point to expression of representative gene for each particular cluster. All scale bars: 200μm, except for Nkx2–1: 100μm. A, anterior; fg, foregut; hg, hindgut; L, left; mg, midgut; no, notochord; R, right; P, posterior. b, Density of E8.75 cells along the AP pseudo-space axis. c, Comparison of empirical AP pseudo-space axis and the predicted AP pseudo-space using expression of TFs. Each dot represents the AP pseudo-space computed by all genes, verses only by the selected TFs. d, Plot showing the ranking of different TFs according to their predictive power based on the regression model. e, Heatmap showing the coefficients for the top TFs when different proportions for cells are subsampled for the regression (total cells: 24990). f, Heatmap showing the Pearson correlation of TF coefficients in (e), highlighting the robustness of TF coefficients in regression.

