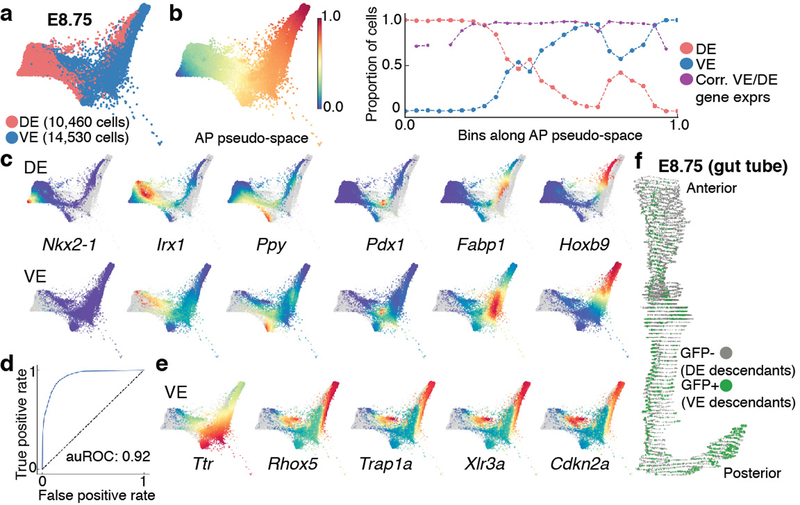
Figure 4: Anterior-Posterior pseudo-spatial axis of cells residing within the E8.75 gut tube.
Force directed layout of E8.75 VE/DE cells combining anterior/posterior cells with Afp-GFP-positive/AFP-GFP-negative cells using mNNCorrect27 (panels a-c, e). a, Cells colored based on measured or inferred AP position. b, Inferred anterior-posterior (AP) pseudo-space (left) and proportion of VE/DE cells in bins along AP pseudo-space (right). Purple dots represent correlation of aggregate expression VE/DE cells in corresponding bins. c, Expression of key organ markers in DE (top) and VE cells (bottom). d, Receiver operating curve for classification of E8.75 VE/DE cells using model trained on E7.5 cells. e, Expression of classifier genes best predictive VE. f, 3D rendering of gut tube depicting all endoderm cells along AP axis. Nuclei of VE/DE cells labeled in green/grey, respectively.

