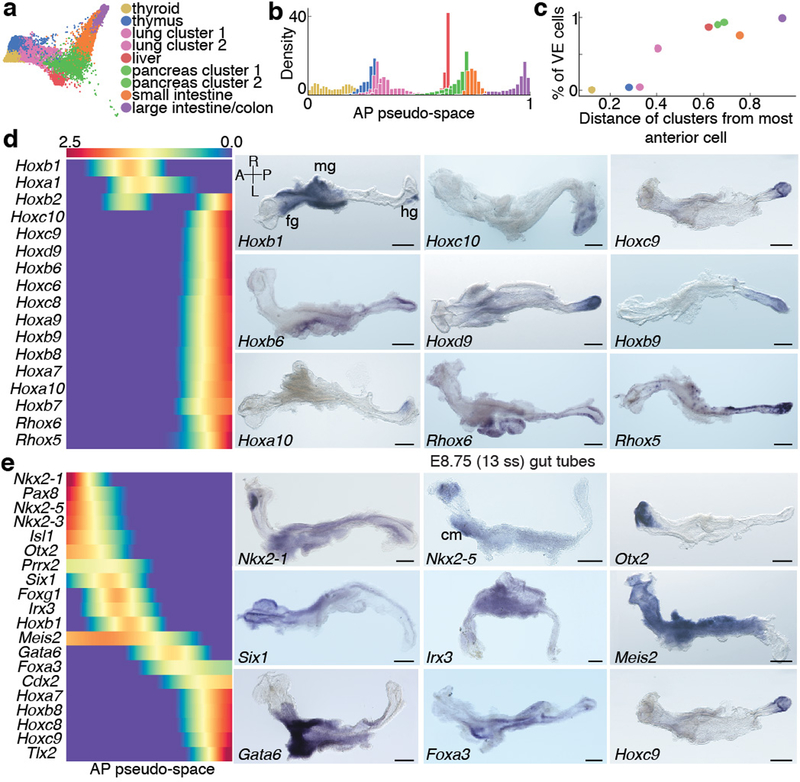
Figure 5: Spatial patterning and organ identities within the E8.75 gut tube of the mouse embryo.
a, Force directed graph of E8.75 cells colored by Phenograph clusters, annotated with putative endodermal organ associated with each cluster. b, Density of cells, per Phenograph cluster along AP pseudo-space. c, Percentage VE cells per cluster, ordered by average distance from anterior tip of AP pseudo-space. d, Heatmap of Hox gene expression along AP pseudo-space (left). Validation of Hox gene expression by ISH on E8.75 gut tubes (n >3 for each gene) (right). e, Heatmap of TF expression most predictive of AP pseudo-space in a regression model. Columns represent cells ordered by pseudo-space, each row representing expression of a particular TF. TFs ordered by expression along AP pseudo-space. Validation of predictive AP expression by ISH on E8.75 gut tubes (n >3 for each gene) (right). Scale bars: 200μm, except for Nkx2–1, Irx3: 100μm. A, anterior; cm, cardiac mesoderm; fg, foregut; hg, hindgut; L, left; mg, midgut; R, right; P, posterior. Scale bars: 200μm, except for Hoxc10: 100μm.

