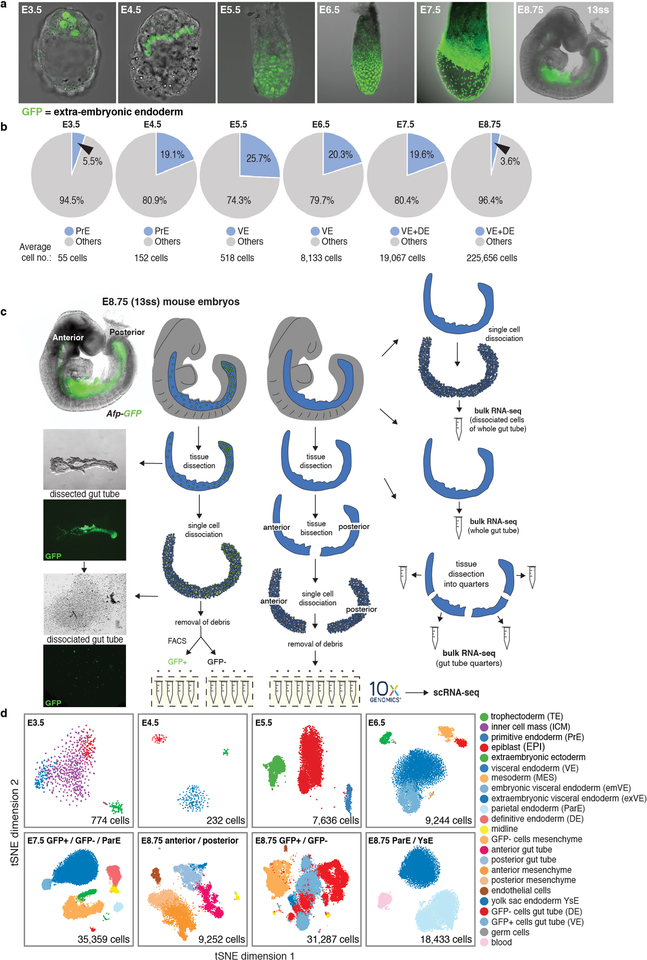
Extended Data Figure 1: Endoderm cell representation in mouse embryos, from blastocyst through midgestation, and single-cell collection pipeline.
a, Distribution of extra-embryonic endoderm cells (GFP/green) from blastocyst (E3.5) to midgestation (E8.75, 13ss) demarcated using PdgfraH2B-GFP20 (pre-implantation stages) and Afp-GFP12 (post-implantation stages) reporters. Extra-embryonic endoderm (PrE and VE derivatives) cells contribute to the gut tube of the E8.75 embryo. b, Pie charts depicting fraction of endoderm cells per embryo, for all stages analyzed in this study. c, Schematic of protocol used for single cell collection, with E8.75 gut tube provided as an example. Gut tubes were micro-dissected from embryos, then dissociated into single cells. Single cells of either anterior and posterior halves of gut tubes, or AFP-GFP-positive (VE descendants) and AFP-GFP-negative (DE descendants) collected using FACS, were used for single-cell 3’ mRNA library construction on the 10x Genomics Chromium platform. For bulk RNA-seq, whole gut tubes dissociated into single cells and then pooled, whole intact gut tubes, and whole gut tubes dissected into quarters, were collected for sequencing. d, tSNE plots of collected libraries for each time-point with each dot representing a single cell. Phenograph was used to identify clusters of cells, color-coded by cell type with annotation based on expression of known markers.

