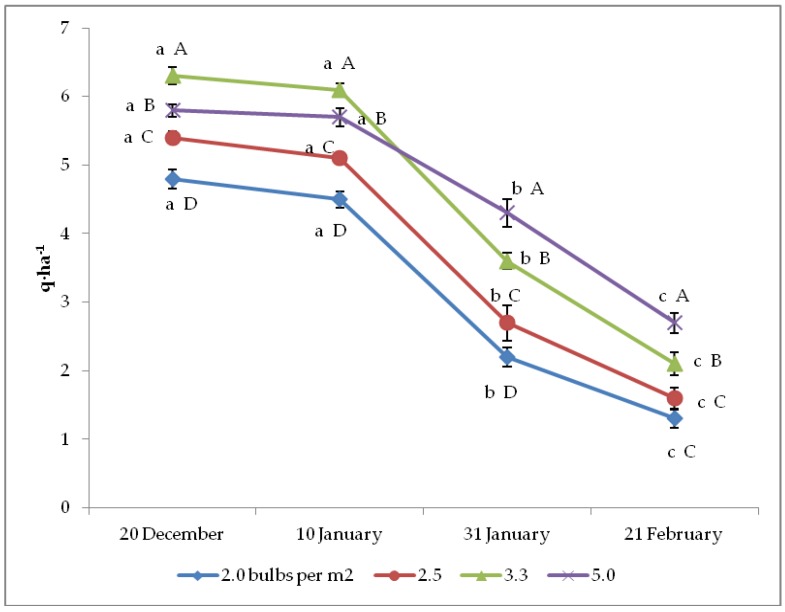
Figure 2.
Interaction between bulb planting time and density on onion seed yield per ha (n = 3). Different letters mean significant difference in the comparison between planting times (lowercase letters) or between bulb densities (capital letters), according to the Duncan test at p ≤ 0.05. Standard deviation bars are shown per each value.

