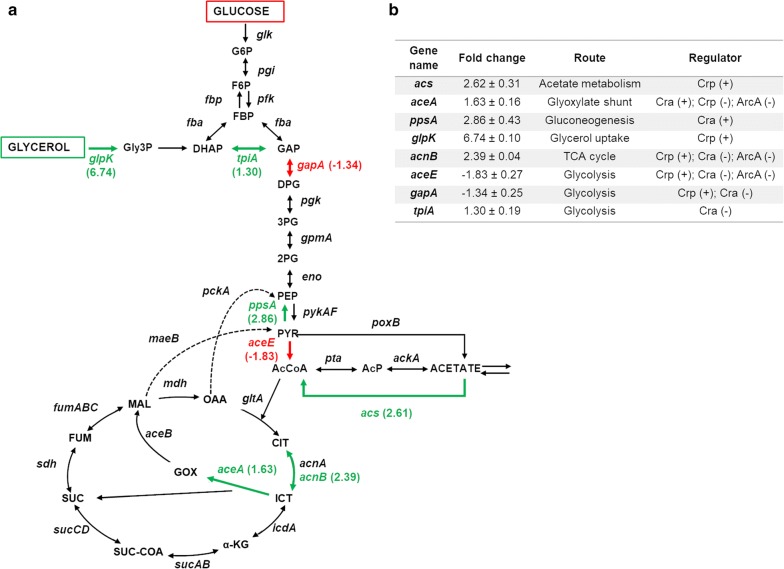
Fig. 5.
Relative gene transcription values in E. coli BL21 wt. Relative gene transcription of E. coli BL21 wt growing in glycerol, as compared to E. coli Bl21 wt growing in glucose. a The genes of the central metabolism studied are show in red (underexpressed in glycerol with respect to glucose) or in green (overexpressed in glycerol with respect to glucose). Metabolite abbreviations: Gly3P glycerol-3-phosphate, G6P glucose-6-phosphate; F6P fructose-6-phosphate, FBP fructose-1,6-biphosphate, DHAP dihydroxyacetone phosphate, GAP glyceraldehyde-3-phosphate, DPG 1,3-bisphosphoglycerate, 3PG 3-phosphoglycerate, 2PG 2-phophoglycerate, PEP phosphoenolpyruvate, PYR pyruvate, AcCoA acetyl coenzyme A, AcP acetyl phosphate, CIT citrate, ICT isocitrate, GOX glyoxylate, α-KG α-ketoglutarate, SUC-CoA succinyl-coenzyme A, SUC succinate, FUM fumarate, MAL malate, OAA oxaloacetate. b The table shows fold changes of transcription level of selected genes in glycerol growth compared with glucose growth, the route to which they belong and the global regulators that regulates positively (+) or negatively (−) its expression

