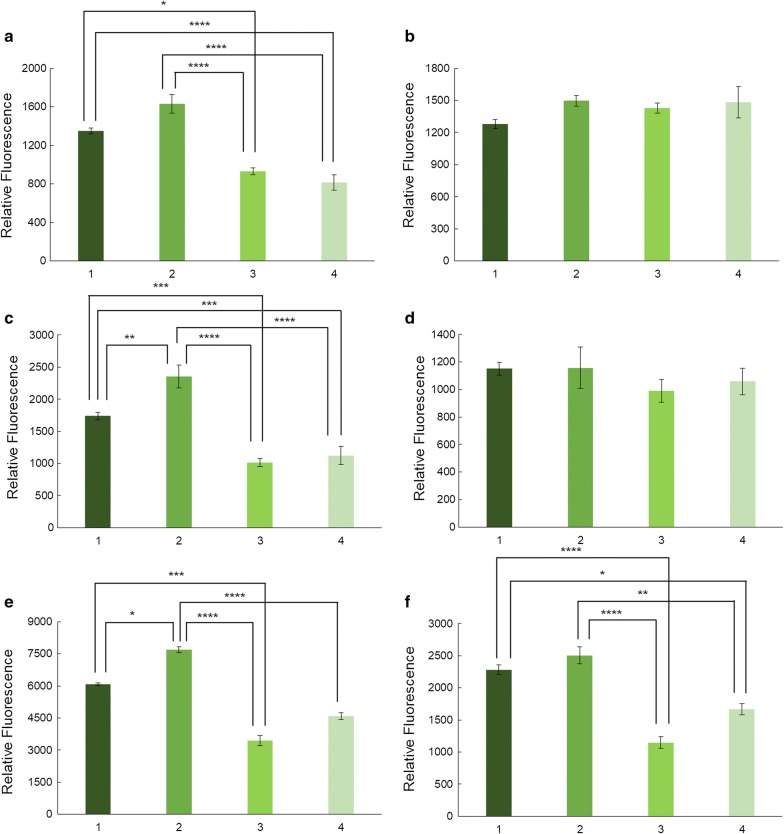
Fig. 7.
Relative fluorescence intensity for each strain growing in all culture conditions. E. coli BL21 wt (a) and deletion strains (ΔpatZ (b), ΔcobB (c), Δacs (d), ΔackA (e) and Δpta (f)). Glucose-TB7 [1] glycerol-TB7 [2], glucose-MM9 [3] and glycerol-MM9 [4]. Statistical analysis by two-way ANOVA was carried out comparing relative fluorescence between culture media in each strain (p-value < 0.0001 (****), < 0.001 (***), < 0.01 (**), < 0.05(*))

