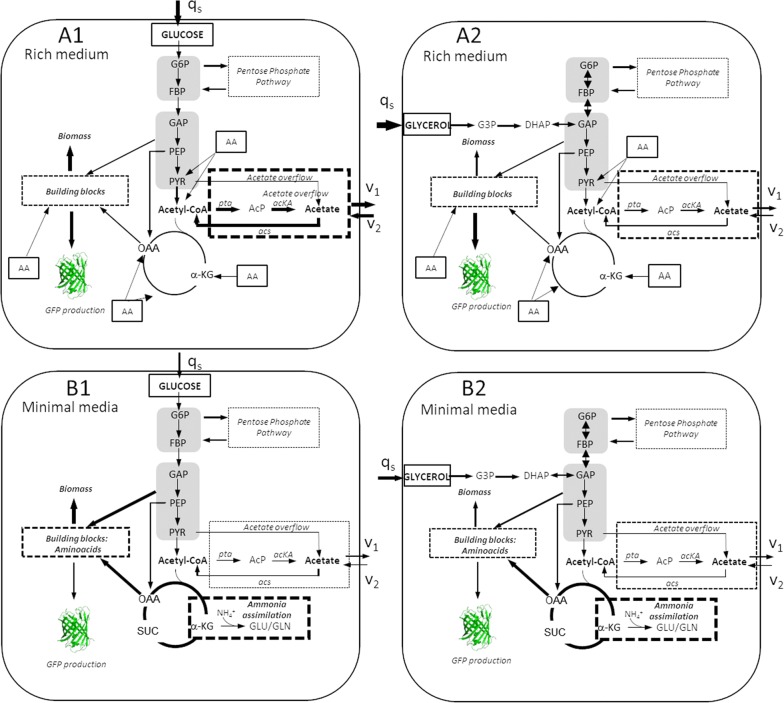
Fig. 9.
Central metabolic pathway of E. coli BL21 at different aerobic growth conditions. A. Rich medium supplemented with glucose (a1) or glycerol (a2). B Minimal medium supplemented with glucose (b1) or glycerol (b2). The thickness of the arrows represents the relative flux comparing growth cultures. (qs, data shown in Table 2; v1, acetate production rate and v2, acetate consumption rate, data shown in Table 3)

