Fig. 1.

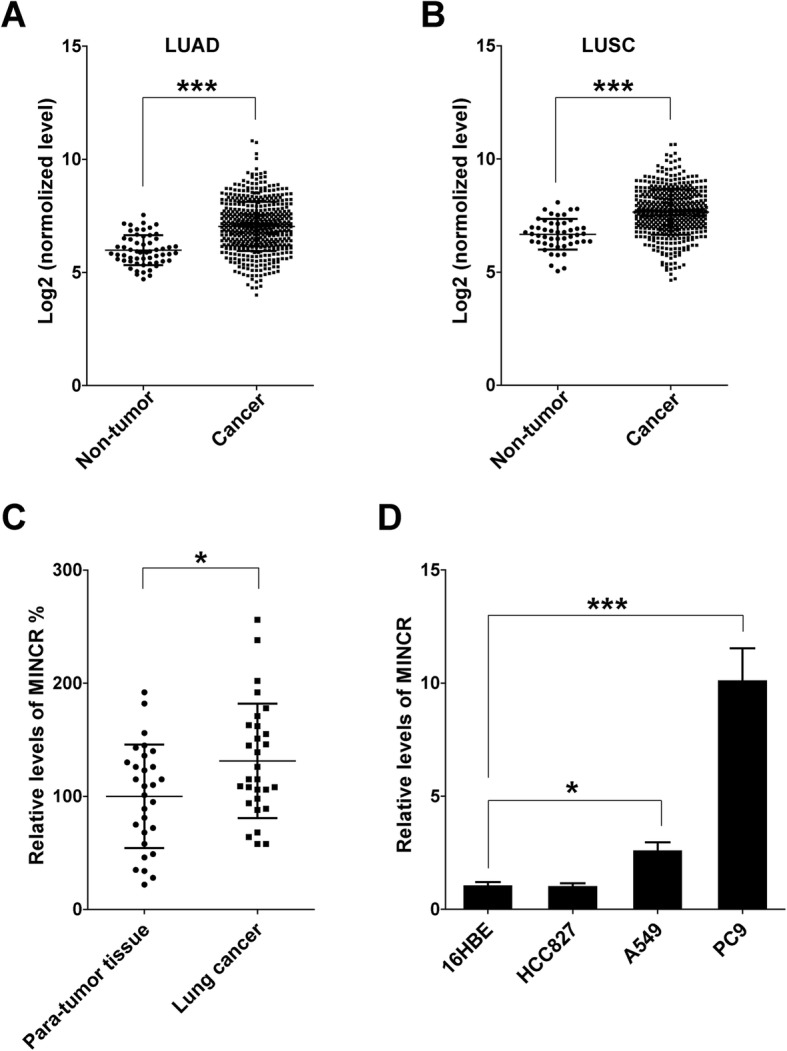
The expression of MINCR in NSCLC tissues and lung cancer cell lines. a-b, comparing expression of MINCR in non-tumor and NSCLC tissues (Lung Adenocarcinoma, LUAD; Lung Squamous Cell Carcinoma, LUSC) using data from The Cancer Genome Atlas (TCGA). c, relative expression levels of MINCR in para-tumor and cancer tissues from NSCLC patients (N = 29). d, relative expression levels of MINCR in 16HBE, HCC827, A549 and PC9 cell lines (N = 3). Data were presented as mean ± standard deviation (SD); *, p < 0.05; **, p < 0.01; ***, p < 0.001
