Figure 2.

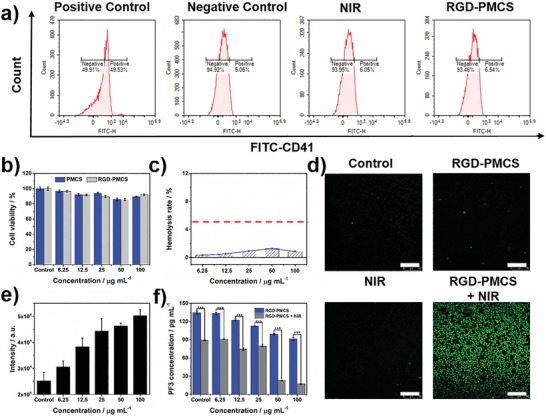
a) Flow cytometry quantification platelets after co‐culturing with RGD‐PMCS (100 µg mL‐1) or irradiating by NIR laser (808 nm, 2 W cm−2, 3 min). ADP activated platelets were adopted as positive group. Platelets without any treatment were explored as negative control. b) Relative viabilities of HUVEC after co‐incubation with different concentrations of PMCS or RGD‐PMCS. c) Hemolysis rate of RGD‐PMCS. d) The intracellular ROS production of erythrocytes co‐incubated with RGD‐PMCS at 100 µg mL−1 under NIR laser irradiation (808 nm, 2 W cm−2, 3 min). Scale bar = 100 µm. e) Quantitative analysis ROS generation in erythrocytes after treating with various concentrations of RGD‐PMCS combined 808 nm light (2 W cm−2, 3 min). f) Level of PF3 after various treatments. P > 0.05, *P < 0.05, **P < 0.01, ***P < 0.001.
