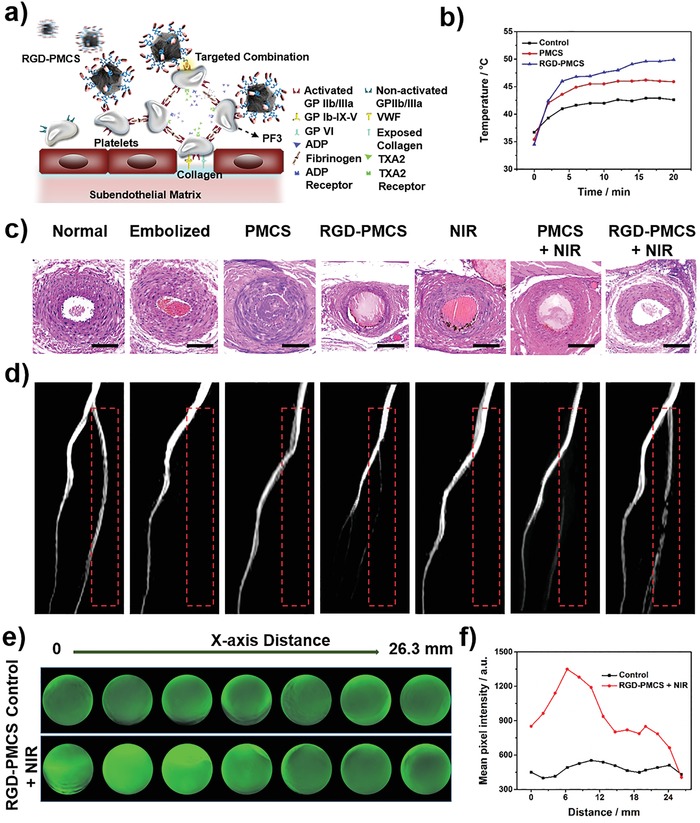
Figure 4.

a) Scheme for site‐specific targeting thrombus of RGD‐PMCS. b) Temperature increase curves of left lower limb of rats intravenously injected with PBS, PMCS (10 mg kg‐1), and RGD‐PMCS (10 mg kg‐1) and irradiated by NIR laser (2 W cm−2, 20 min). c) Histopathology and d) MRI of rats after various treatments. Scale bar = 100 µm. The red dashed line indicates the site of thrombus. e) PA images and f) Quantitative analysis of the signals collected from simulated blood vessel in different cross sections after different treatments (2 W cm‐2, 10 min).
