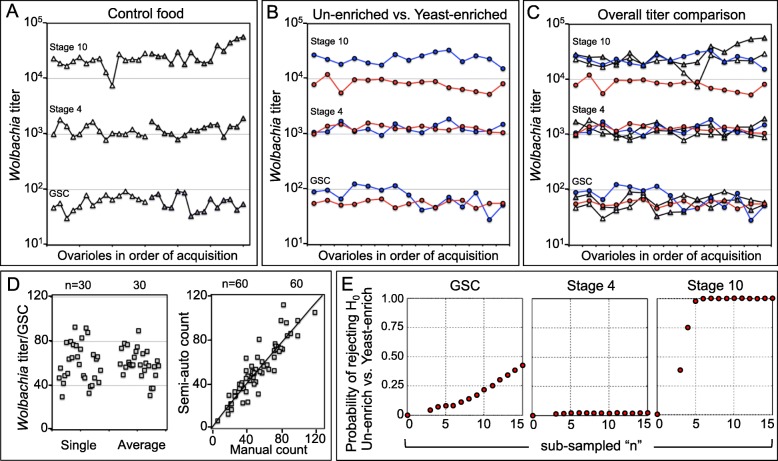
Fig. 4.
Analysis of Wolbachia titer across oogenesis. GSC: Germline stem cell. a Titer data, displayed by stage and order of ovariole acquisition. White: First 15 ovarioles imaged. Grey: Last 15 ovarioles imaged. b Germline titer data in response to nutritional conditions. Blue: Un-enriched control. Red: Yeast-enriched treatment. c Overlay of all 3-dimensional titer data, in groups of 15 ovarioles. d Left: Comparison of control titer data for single GSCs versus median GSC titers scored in GSC clusters. Right: Comparison of data acquired by semi-automated versus manual assessment methods. Black line indicates regression analysis. e Comparing randomly sub-sampled data from un-enriched control and yeast-enriched treatment conditions. 10,000 iterations determined the frequency of significance, with alpha set at 0.01 (n = 3–15 ovarioles). Tests used: Independent T-tests: GSCs and stage 10. Mann-Whitney U: stage 4

