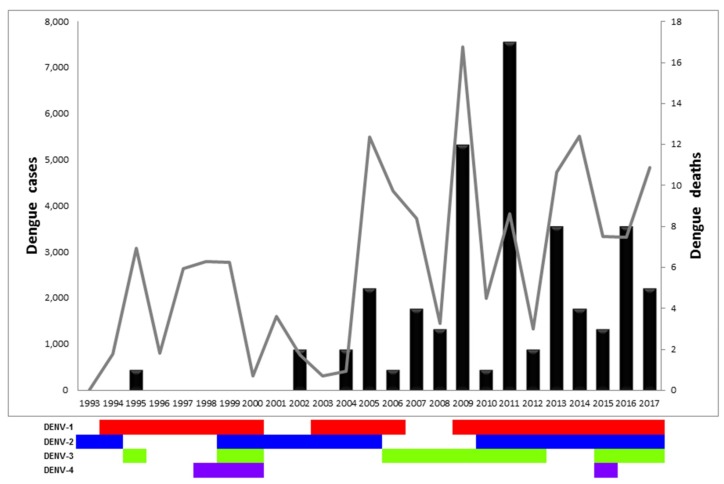
Figure 1.
Dengue cases, dengue deaths, and circulating serotypes in Panama from 1993 to 2017. Graph representing the number of dengue cases (gray line, left Y axis), dengue deaths (black bars, right Y axis), and circulating serotypes per year (DENV-1 in red, DENV-2 in blue, DENV-3 in green, DENV-4 in violet).

