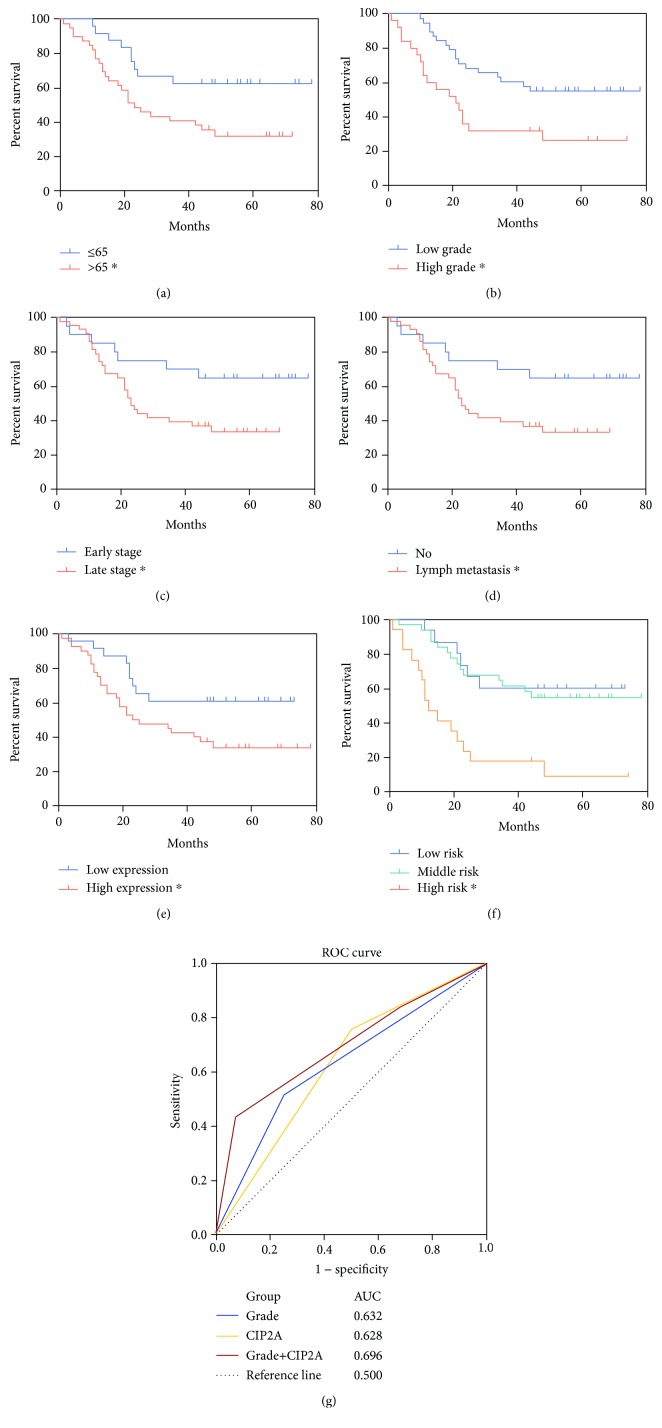
Figure 2.
Survival analysis of clinicopathologic parameters and CIP2A expression. Kaplan-Meier analysis of survival based on (a) age, (b) grade, (c) stage, (d) lymph metastasis, (e) CIP2A expression, and (f) combination of grade and CIP2A expression (log-rank test, ∗P < 0.05). Low risk: low grade and low CIP2A expression; middle risk: low grade and high CIP2A expression/high grade and low CIP2A expression; high risk: high grade and high CIP2A expression. (g) ROC analysis of survival prediction power. The area under the curve (AUC) value was calculated from the ROC curve.

