
Figure 2.
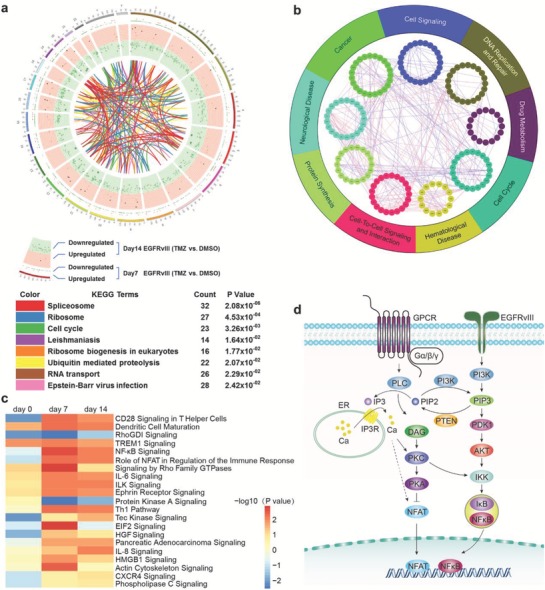
The major pathways involved in TMZ resistance. a) Differential expression profiles between EGFRvIII and control cells treated with TMZ at days 7 and 14. The KEGG database was used to show the connection between the genes (Table S6, Supporting Information). b) Differentially expressed genes were calculated by interactive genetic algorithm (IGA), and the genes were enriched in DNA replication, repair, and the cell cycle. c) Pathway enrichment analysis for up‐ and downregulated genes between EGFRvIII and control cells treated with TMZ at days 7 and 14. d) Schematics illustrating the EGFRvIII/PI3K/AKT/NF‐κB and GPCR/PLC/DAG/NFAT signaling pathways which are most significantly changed in EGFRvIII‐overexpressing cells treated with TMZ at two time points.