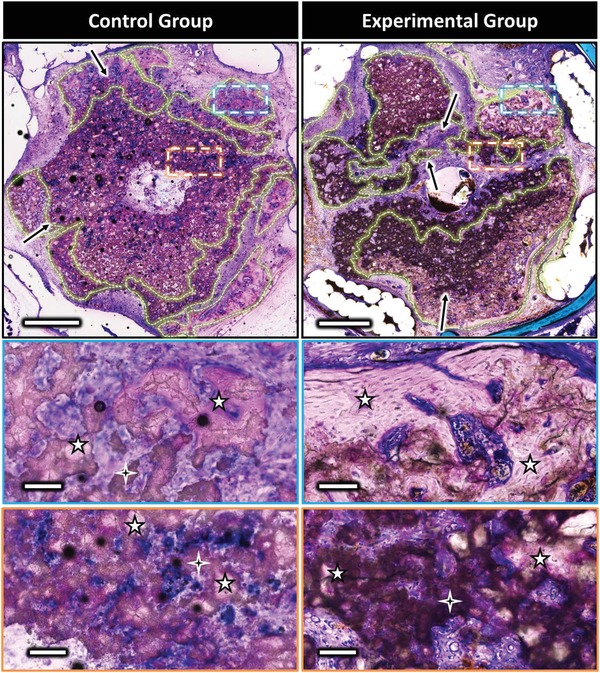
Figure 4.

Representative mineralized axial sections from middle region of the control (left) and the experimental (right) scaffolds at low and high magnification (basic fuchsin and methylene blue). Zones illustrating the ceramic biodegradation are highlighted by the black arrows. Lamellar bone could be observed in the zones delineated by dotted lines, representing high magnification images shown in insets. The 4 and 5 branch stars indicate biocement and bone, respectively. Scale bars on low and high magnification represent 1 mm and 100 µm, respectively. Sections of replicate sample are shown in Figure S2 in the Supporting Information.
