
Figure 5.
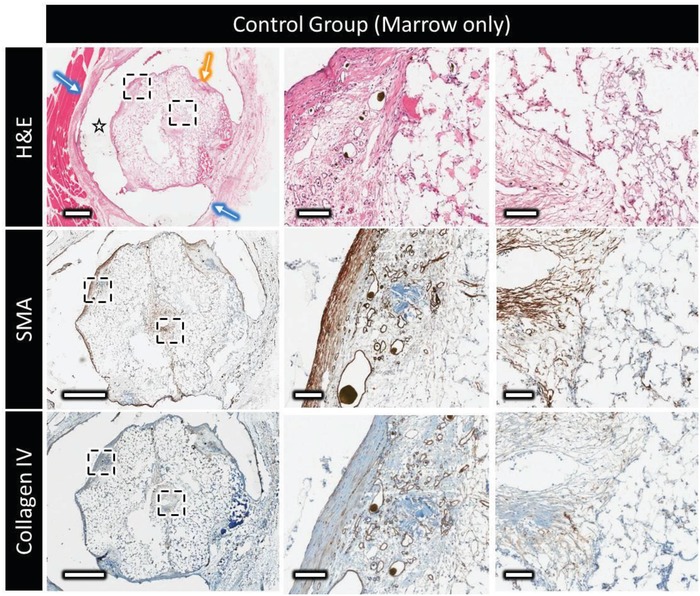
Decalcified histology and immunohistochemistry of the control marrow construct, showing top to bottom: H&E at low and high magnification showing the distribution and organization of the extracellular matrix outside and within the scaffold (star = polymer clip, blue arrow = thick vascular capsule surrounding the clip, and yellow arrow = thin vascular capsule surrounding the implant); the expression of α‐smooth muscle actin (brown); type‐IV collagen distribution (in brown). Scale bars on low and high magnification represent 1 mm and 100 µm, respectively.