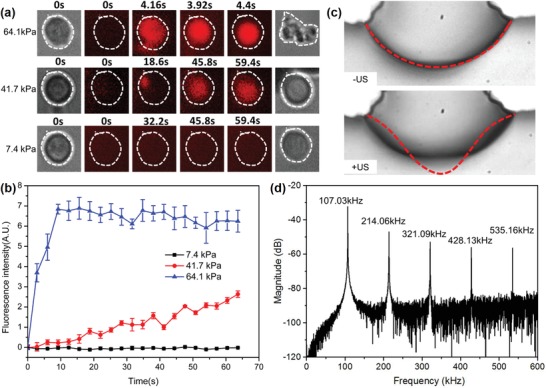
Figure 4.

a) Sonoporation process at various input acoustic amplitudes. b) Quantitative analysis of the PI fluorescence intensity as a function of time (n = 5). c) Membrane deformation of the oscillating microbubble when the acoustic pressure is 41.7 kPa. d) Scattering signal induced by microbubble oscillation. Higher harmonics are detected by PCD, illustrating that stable (noninertial) cavitation occurs.
