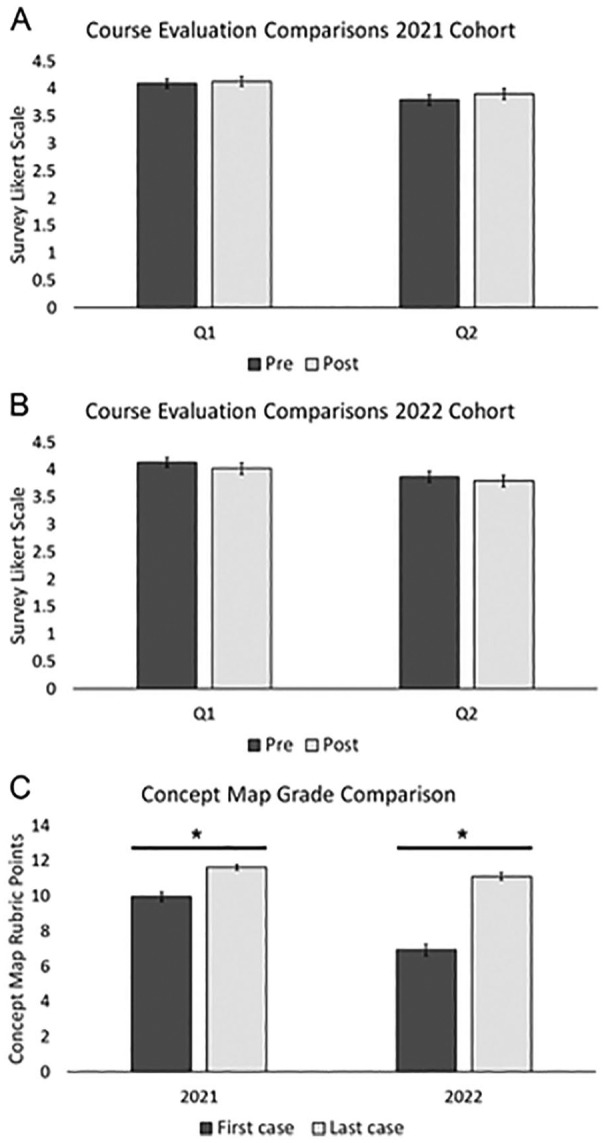
Figure 3.

Concept mapping course evaluation analysis. (A) Course evaluation analysis of 2021 student cohort for survey question 1 (Q1) and question 2 (Q2) showing average Likert-type scale response. (B) Course evaluation analysis of 2022 student cohort for survey Q1 and Q2 showing average Likert-type scale response value. (C) Rubric score comparison of concept maps from first and last clinical case. Error bars represent standard error of the mean.
*P < 0.0001.
